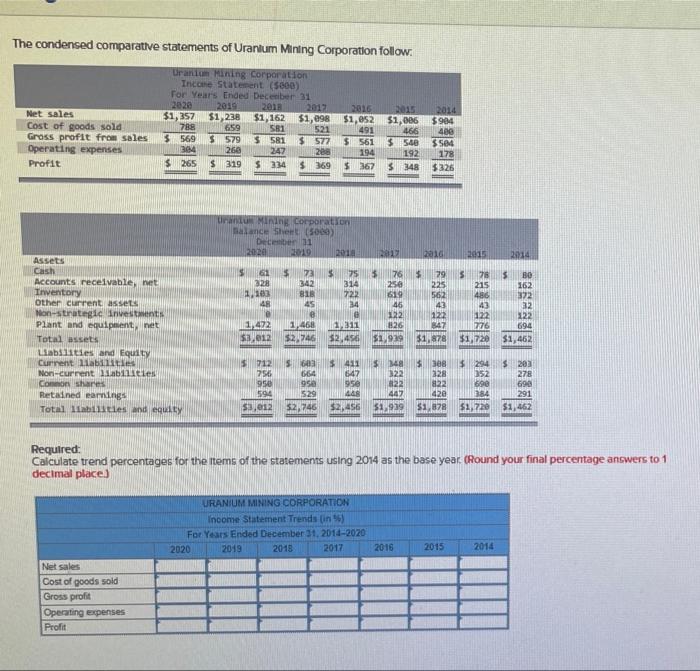
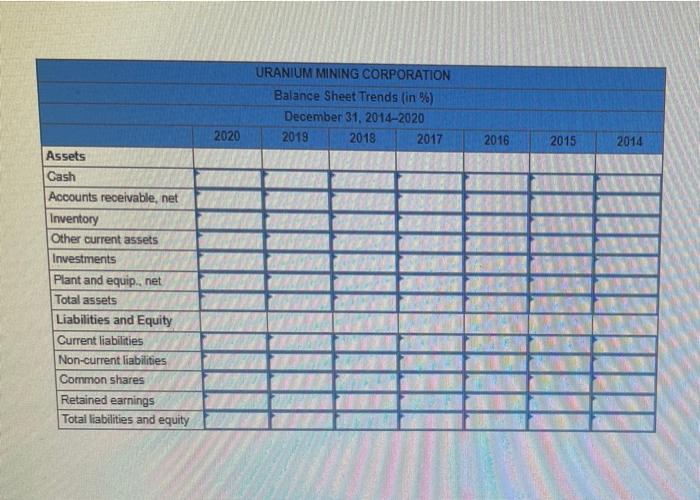
The condensed comparative statements of Uranium Mining Corporation follow Net sales Cost of goods sold Gross profit from sales Operating expenses Profit Urarium Mining Corporation Income Statement (5000) For Year's Ended December 31 2020 2019 2018 2017 2016 $1,357 $1,238 $1,162 $1,98 $1,652 788 581 521 491 $ 569 $ 579 $ 581 $ 577 $ 561 364 266 247 28 $ 265S 319 5 334 369 $367 659 51,086 466 $ 540 192 $ 348 2014 $964 400 $504 178 $326 194 2015 2014 Assets Cash Accounts receivable. net Inventory Other current assets Non-strategic Investments Plant and equipment, net Total assets Liabilities and Equity Current abilities Non-current abilities Common shares Retained earnings Total Tabii tiesind equity Urant Mining Corporation Balance Sheet(500) December 31 2020 2019 2018 23 2010 $ 61 $ 72 $ 75 3 76 79 328 342 314 250 225 1103 BI 722 619 562 48 45 24 46 43 122 122 1,472 1,468 311 126 847 $3,012 $2.746 32.456$1.99 $1.978 5 25 S BO 215 162 480 372 43 32 1222 122 776 694 $1,720 $1,462 5 712 256 950 594 s3,012 S6 $ 41 SM 664 647 9 950 22 529 IN 442 $2,746 $2,456 $1,919 5 S 328 822 420 $1,878 $ 294 352 6.90 384 $1,720 $ 203 278 698 291 $1,462 Required: Calculate trend percentages for the items of the statements using 2014 as the base year (Round your final percentage answers to 1 decimal place) URANIUM MINING CORPORATION Income Statement Trends in ) For Years Ended December 31, 2014-2020 2020 2019 2018 2017 2016 2015 2014 Net sales Cost of goods sold Gross profit Operating expenses Profit URANIUM MINING CORPORATION Balance Sheet Trends (in %) December 31, 2014-2020 2019 2018 2017 2020 2016 2015 2014 Assets Cash Accounts receivable, net Inventory Other current assets Investments Plant and equip.net Total assets Liabilities and Equity Current liabilities Non-current liabilities Common shares Retained earnings Total liabilities and equity