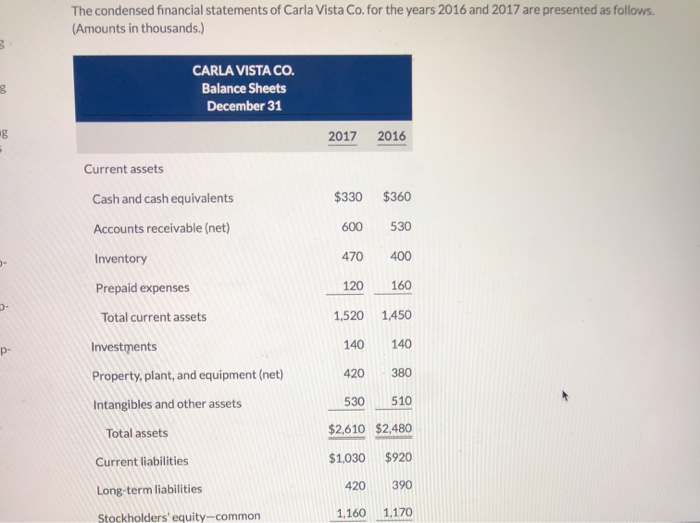
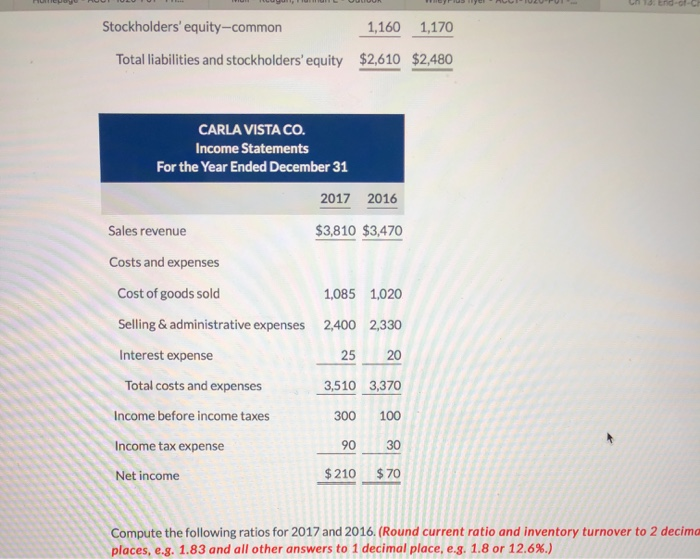
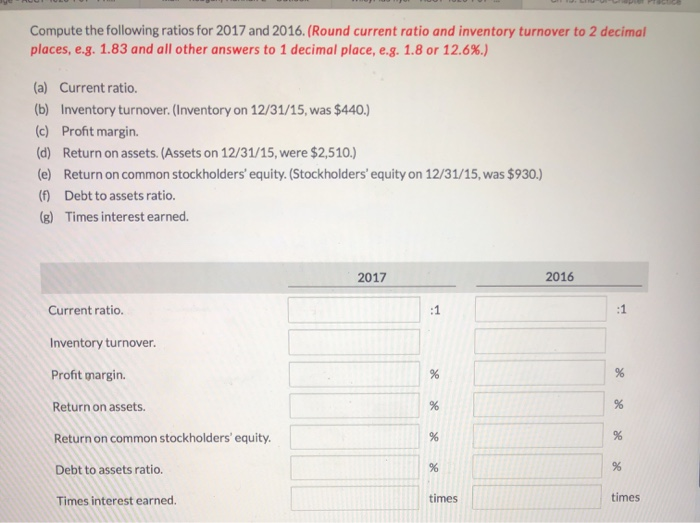
The condensed financial statements of Carla Vista Co. for the years 2016 and 2017 are presented as follows. (Amounts in thousands.) 000 CARLA VISTA CO. Balance Sheets December 31 00 2017 2016 Current assets Cash and cash equivalents $330 $360 Accounts receivable (net) 600 530 Inventory 470 400 Prepaid expenses 120 160 Total current assets 1,520 1,450 Investments 140 140 Property, plant, and equipment (net) 420 380 Intangibles and other assets 530 510 $2,610 $2,480 Total assets Current liabilities $1,030 420 Long-term liabilities $920 390 1,170 Stockholders' equity-common 1.160 NFIUS AJULU PU C A 13. End-of- Stockholders' equity-common 1,160 1,170 Total liabilities and stockholders' equity $2,610 $2,480 CARLA VISTA CO. Income Statements For the Year Ended December 31 2017 2016 Sales revenue $3,810 $3,470 Costs and expenses Cost of goods sold Selling & administrative expenses Interest expense Total costs and expenses 1,085 1,020 2,400 2,330 25 20 3,510 3,370 300 100 90 30 $ 210 Income before income taxes Income tax expense Net income Compute the following ratios for 2017 and 2016. (Round current ratio and inventory turnover to 2 decima places, e.g. 1.83 and all other answers to 1 decimal place, e.g. 1.8 or 12.6%.) Compute the following ratios for 2017 and 2016. (Round current ratio and inventory turnover to 2 decimal places, e.g. 1.83 and all other answers to 1 decimal place, e.g. 1.8 or 12.6%.) (a) Current ratio. (b) Inventory turnover. (Inventory on 12/31/15, was $440.) (c) Profit margin. (d) Return on assets. (Assets on 12/31/15, were $2,510.) (e) Return on common stockholders' equity. (Stockholders' equity on 12/31/15, was $930.) (f) Debt to assets ratio. (g) Times interest earned. 2017 2016 Current ratio. Inventory turnover. x Profit margin. x Return on assets. x Return on common stockholders' equity. x Debt to assets ratio. Times interest earned. times