

Answered step by step
Verified Expert Solution
Question
1 Approved Answer
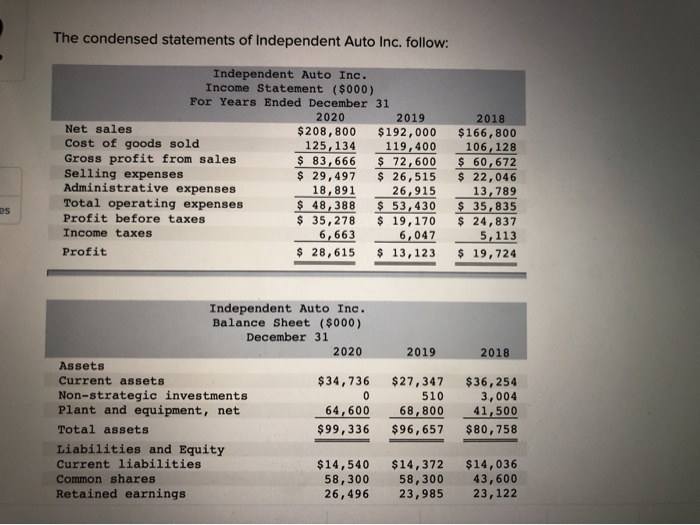
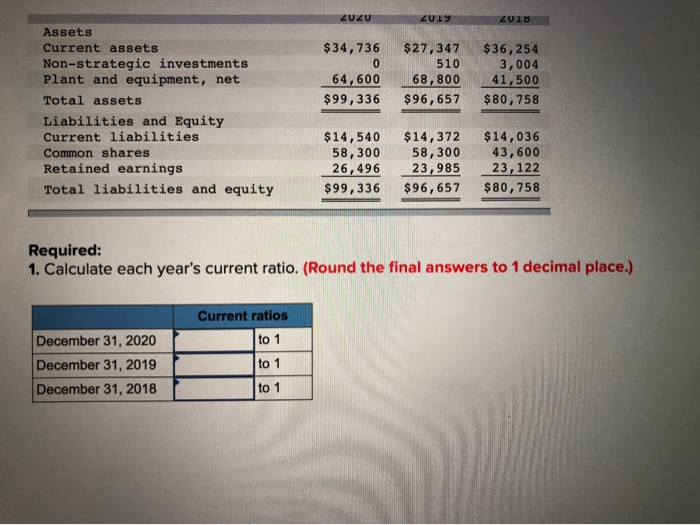
The condensed statements of Independent Auto Inc. follow: Independent Auto Inc. Income Statement ($000) For Years Ended December 31 2020 2019 Net sales $208,800 $192,000
Step by Step Solution
There are 3 Steps involved in it
Step: 1

Get Instant Access to Expert-Tailored Solutions
See step-by-step solutions with expert insights and AI powered tools for academic success
Step: 2

Step: 3
Ace Your Homework with AI
Get the answers you need in no time with our AI-driven, step-by-step assistance
Get Started
External Quality Audit Has It Improved Quality Assurance In Universities
Authors: Mahsood Shah, Chenicheri Sid Nair
1st Edition
1843346761, 978-1843346760