Question
THE CONDUCTER A LINEAR PYTHON NETWORKING REGRESSION FOR THE MATLAB SYNTAX HEREIN. Ensure that the SIMULATED NETWORK IS FIT TO THE GRAPH exponentially. This question
THE CONDUCTER A LINEAR PYTHON NETWORKING REGRESSION FOR THE MATLAB SYNTAX HEREIN. Ensure that the SIMULATED NETWORK IS FIT TO THE GRAPH exponentially.
This question involves the use of AGGREGATE linear PYTHOIN regression on the Auto data set. (a) Perform a simple linear regression with mpg as the response and horsepower as the predictor.
Describe the null hypotheses to which the p-values given in Table 3.4 correspond. Explain what conclusions you can draw based on these p-values. Your explanation should be phrased in terms of sales, TV, radio, and newspaper, rather than in terms of the coefficients of the linear model. Mad Libs are activities that have a person provide various words, which are then used to short story in unexpected (and hopefully funny) ways. a) Produce a scatterplot matrix which includes all of the variables in the data set.
(b) Compute the matrix of correlations between the variables.
(c) Perform a multiple linear regression with mpg as the response and all other variables except name as the predictors and print the results. Comment on the output. For instance:
i. Is there a relationship between the predictors and the response?
ii. Which predictors appear to have a statistically significant relationship to the response?
iii. What does the coefficient for the year variable suggest?
(d) Produce diagnostic plots of the linear regression fit. Comment on any problems you see with the fit. Do the residual plots suggest any unusually large outliers? Does the leverage plot identify any observations with unusually high leverage?
(e) Fit linear regression models with interaction effects. ny interactions appear to be statistically significant?
(f) Try a few different transformations of the variables, such as log(X), ? X, X2. Comment on your findings.
Opional
15. This problem involves the Boston data set, which we saw in the lab for this chapter. We will now try to predict per capita crime rate using the other variables in this data set. In other words, per capita crime rate is the response, and the other variables are the predictors.
(a) For each predictor, fit a simple linear regression model to predict the response. Describe your results. In which of the models is there a statistically significant association between the predictor and the response? Create some plots to back up your assertions.
(b) Fit a multiple regression model to predict the response using all of the predictors. Describe your results. For which predictors can we reject the null hypothesis H0 : ?j = 0?
(c) How results from (a) compare to your results from (b)? plot displaying the univariate regression coefficients from (a) on the x-axis, and the multiple regression coefficients from (b) on the y-axis. That is, each predictor is displayed as a single point in the plot. Its coefficient in a simple linear regression model is shown on the x-axis, and its coefficient estimate in the multiple linear regression model is shown on the y-axis.
(d) Is there evidence of non-linear association between any of the predictors and the response? To answer this question, for each predictor X, fit a model of the form


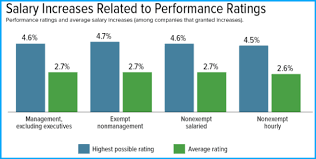
Salary Increases Related to Performance Ratings Performance ratings and average salary increases (among companies that granted increase 4.6% 4.7% 4.6% 2.7% Management, excluding executives 2.7% Exempt nonmanagement Highest possible rating 2.7% Noncompt salaried Average rating 4.5% 2.6% Non sempt hourly
Step by Step Solution
There are 3 Steps involved in it
Step: 1

Get Instant Access to Expert-Tailored Solutions
See step-by-step solutions with expert insights and AI powered tools for academic success
Step: 2

Step: 3

Ace Your Homework with AI
Get the answers you need in no time with our AI-driven, step-by-step assistance
Get Started


