

Answered step by step
Verified Expert Solution
Question
1 Approved Answer
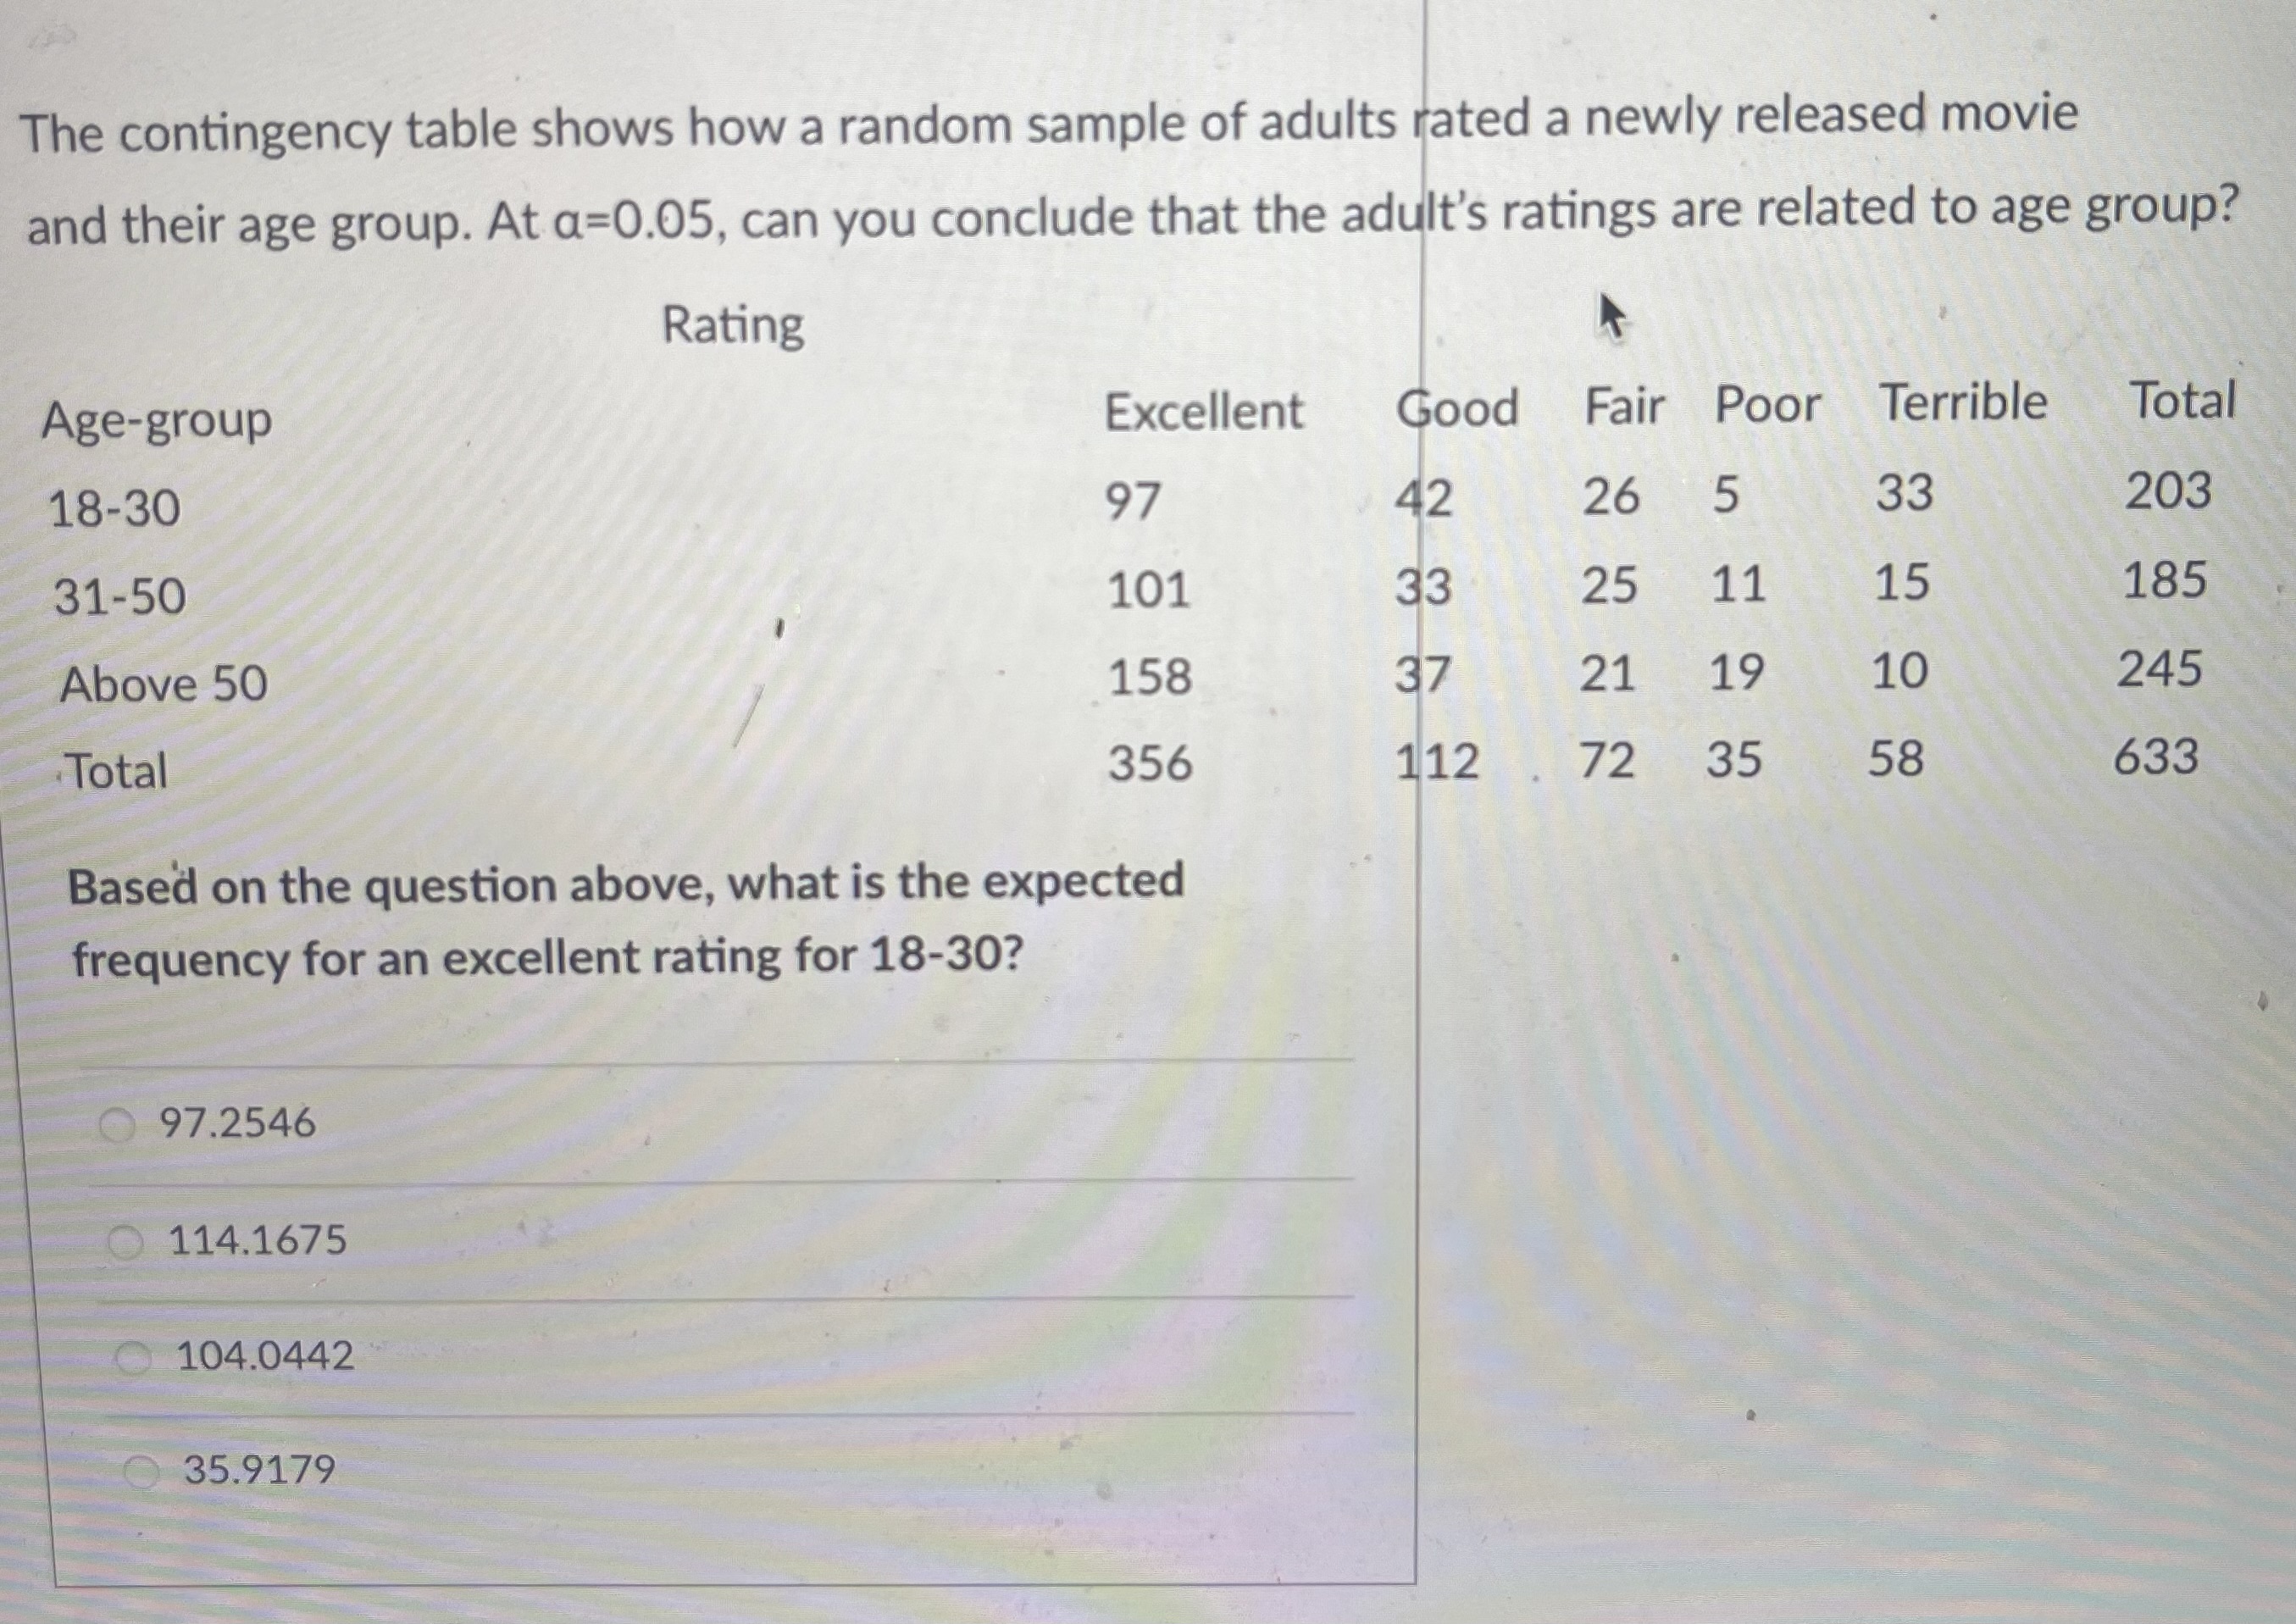
The contingency table shows how a random sample of adults rated a newly released movie and their age group. At a=0.05, can you conclude that
Step by Step Solution
There are 3 Steps involved in it
Step: 1

Get Instant Access to Expert-Tailored Solutions
See step-by-step solutions with expert insights and AI powered tools for academic success
Step: 2

Step: 3
Ace Your Homework with AI
Get the answers you need in no time with our AI-driven, step-by-step assistance
Get Started
Fundamentals Of Business Mathematics In Canada
Authors: F. Ernest Jerome, Jackie Shemko
3rd Edition
1259370151, 978-1259370151