Answered step by step
Verified Expert Solution
Question
1 Approved Answer
The Corporation's forecasted 2020 financial statements follow , along with some Industry average ratios. Jimenez Corporation : Forecasted Balance Sheet as of December 31, 2020
The Corporation's forecasted 2020 financial statements follow , along with some Industry average ratios. 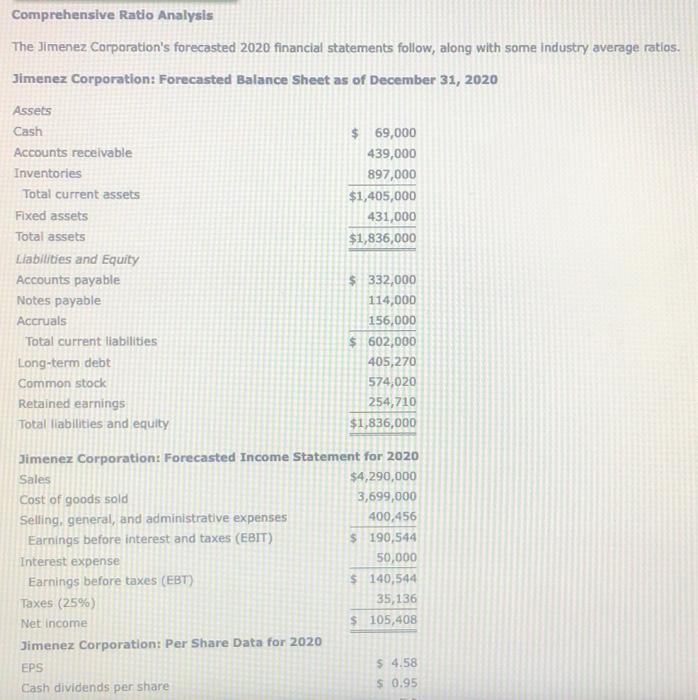
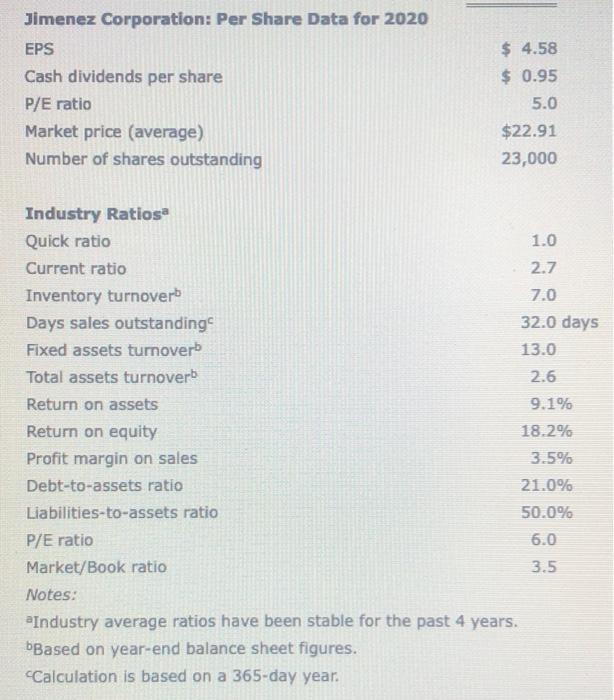

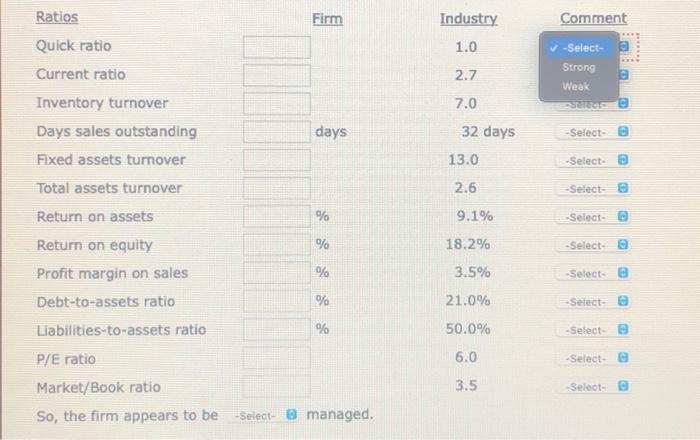
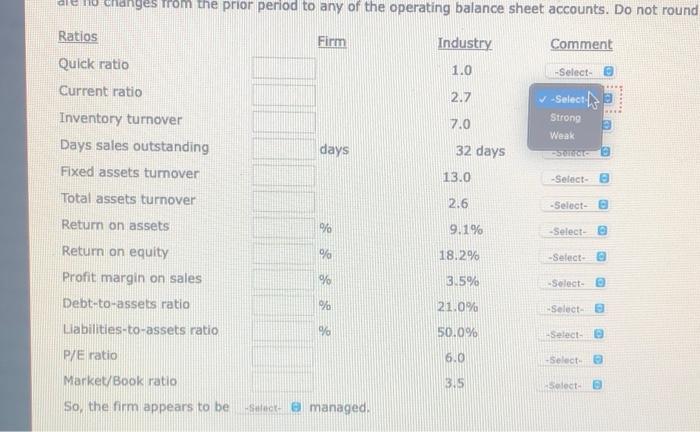
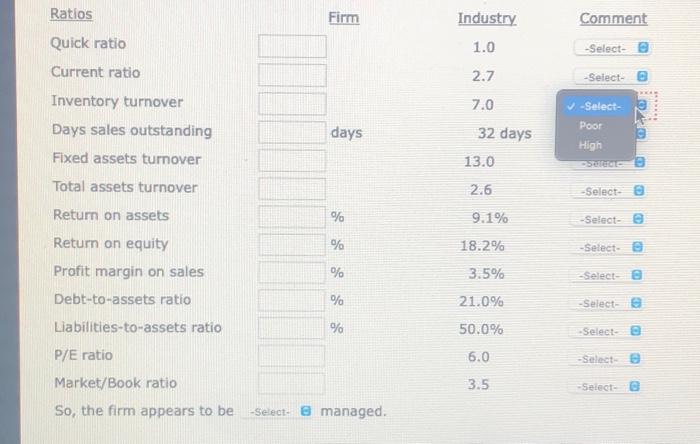
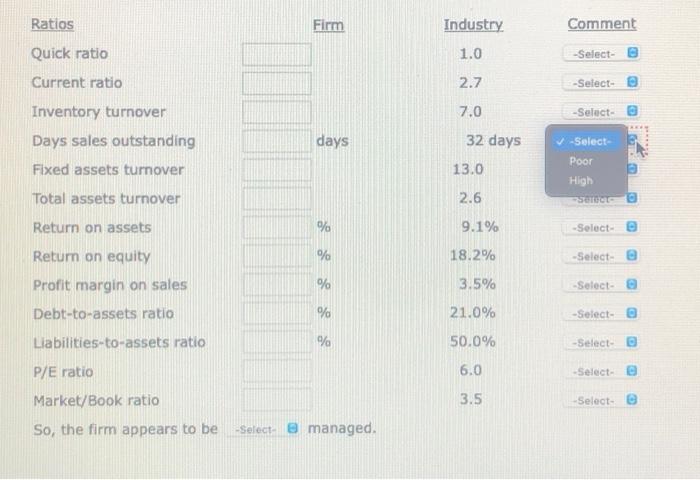
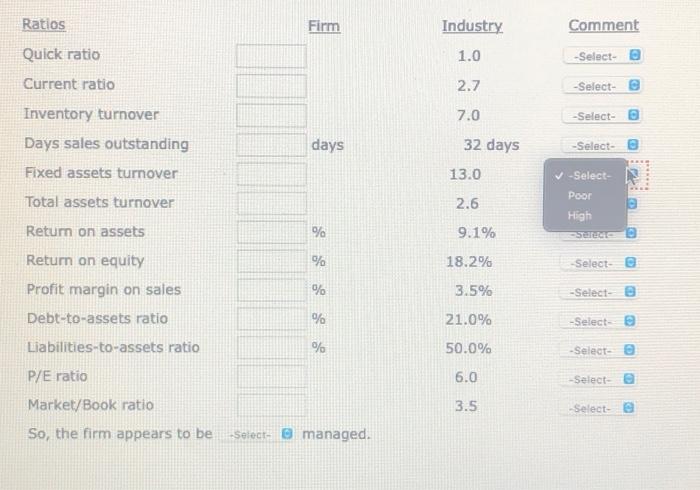
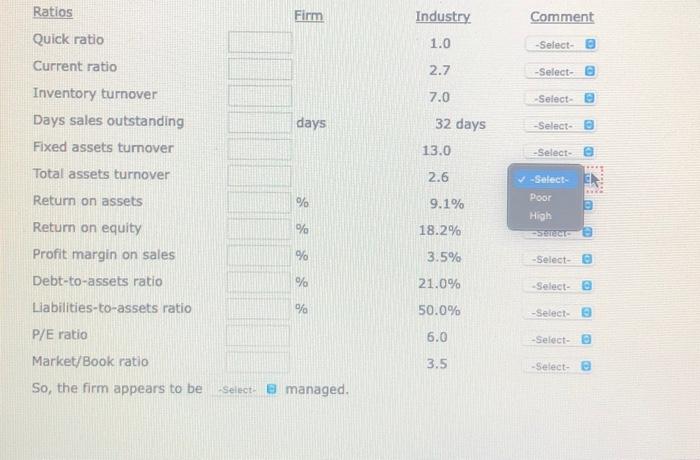
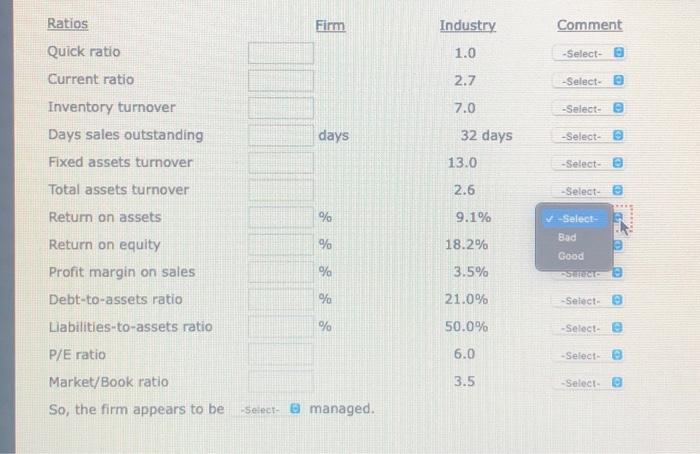
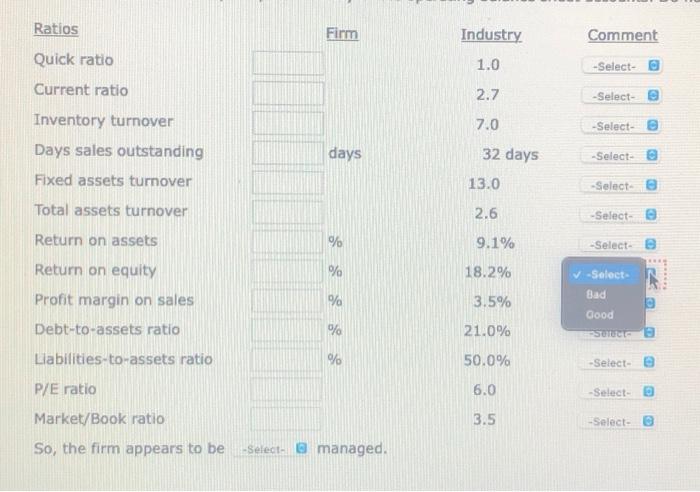
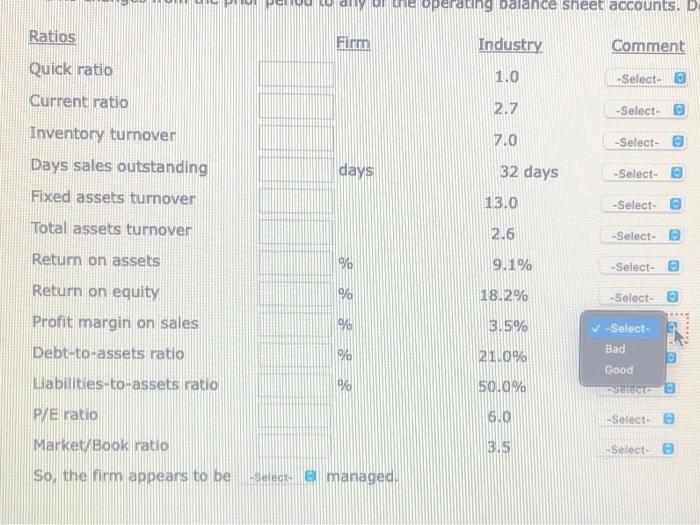
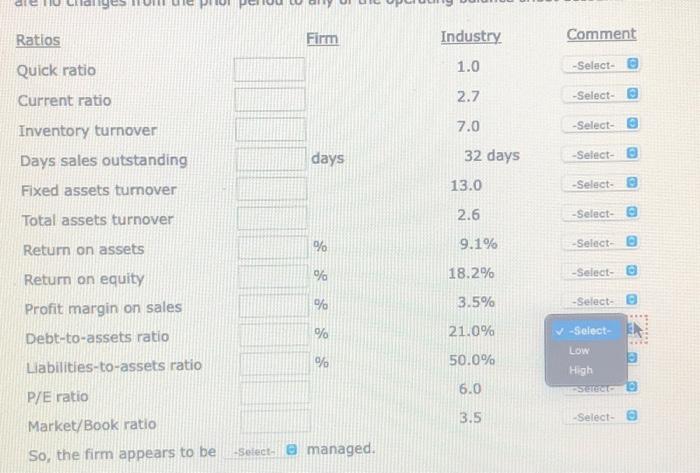
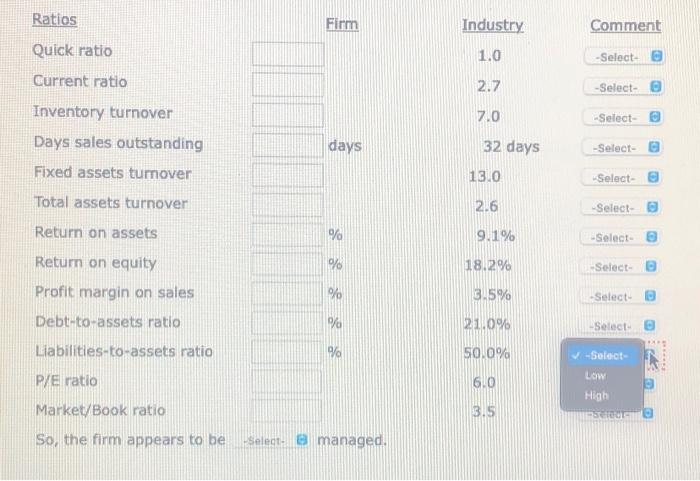
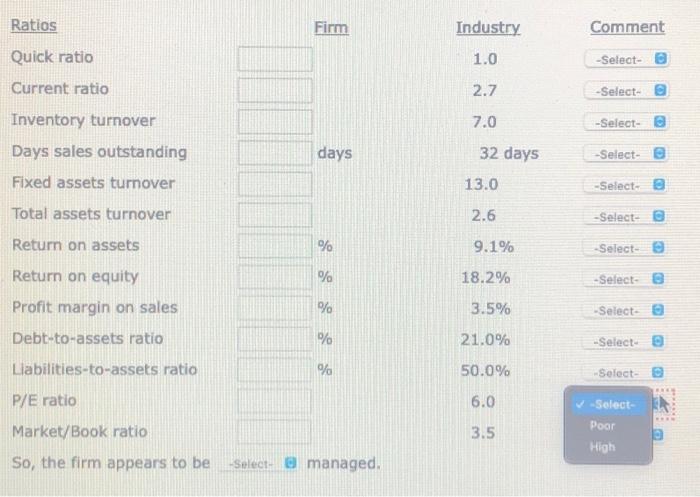
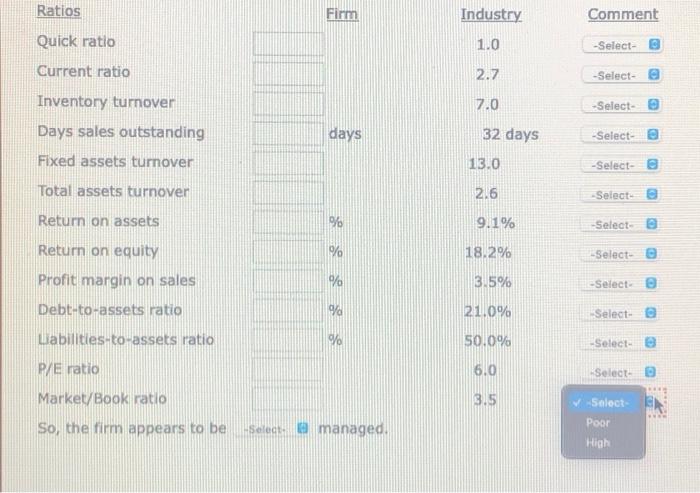
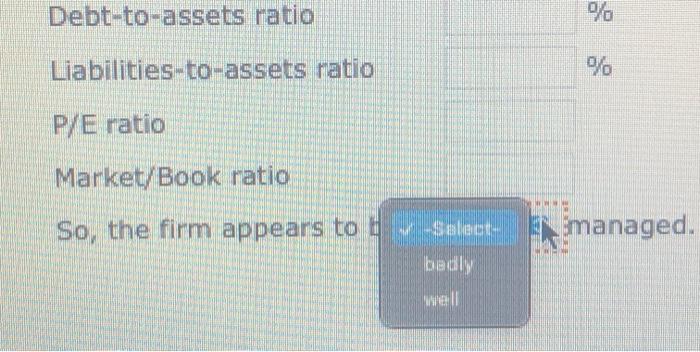
Comprehensive Ratio Analysis The Jimenez Corporation's forecasted 2020 financial statements follow, along with some industry average ratlos. Jimenez Corporation: Forecasted Balance Sheet as of December 31, 2020 Assets Cash $ 69,000 Accounts receivable 439,000 Inventories 897,000 Total current assets $1,405,000 Fixed assets 431,000 Total assets $1,836,000 Liabilities and Equity Accounts payable $ 332,000 Notes payable 114,000 Accruals 156,000 Total current liabilities $ 602,000 Long-term debt 405,270 Common stock 574,020 Retained earnings 254,710 Total liabilities and equity $1,836,000 Jimenez Corporation: Forecasted Income Statement for 2020 Sales $4,290,000 Cost of goods sold 3,699,000 Selling, general, and administrative expenses 400,456 Earnings before interest and taxes (EBIT) $ 190,544 Interest expense 50,000 Earnings before taxes (EBT) $ 140,544 Taxes (25%) 35,136 Net income $ 105,408 Jimenez Corporation: Per Share Data for 2020 EPS $ 4.58 Cash dividends per share $0.95 Jimenez Corporation: Per Share Data for 2020 EPS Cash dividends per share P/E ratio Market price (average) Number of shares outstanding $ 4.58 $ 0.95 5.0 $22.91 23,000 Industry Ratiosa Quick ratio 1.0 Current ratio 2.7 Inventory turnoverb 7.0 Days sales outstanding 32.0 days Fixed assets turnoverb 13.0 Total assets turnoverb 2.6 Return on assets 9.1% Return on equity 18.2% Profit margin on sales 3.5% Debt-to-assets ratio 21.0% Liabilities-to-assets ratio 50.0% P/E ratio 6.0 Market/Book ratio 3.5 Notes: Industry average ratios have been stable for the past 4 years. Based on year-end balance sheet figures. Calculation is based on a 365-day year. Firm Industry Comment 1.0 -Select- Strong Weak 2.7 7.0 days 32 days -Select- 13.0 -Select- 2.6 -Select- Ratios Quick ratio Current ratio Inventory turnover Days sales outstanding Fixed assets turnover Total assets turnover Return on assets Return on equity Profit margin on sales Debt-to-assets ratio Liabilities-to-assets ratio P/E ratio Market/Book ratio So, the firm appears to be % 9.1% -Select- % 18.2% -Select- % 3.5% -Select- % 21.0% Selecte % 50.0% -Select- 6.0 -Select- 3.5 -Select- -Select- @managed. gestrom the prior period to any of the operating balance sheet accounts. Do not round Firm Industry Comment Ratios Quick ratio Current ratio 1.0 -Select- 2.7 v Select Strong Wear 7.0 days Inventory turnover Days sales outstanding Fixed assets turnover Total assets turnover 32 days One 13.0 -Select- 2.6 -Select- Return on assets % 9.1% -Select- % 18.2% -Select % 3.5% -Select- % 21.0% -Select Return on equity Profit margin on sales Debt-to-assets ratio Liabilities-to-assets ratio P/E ratio Market/Book ratio So, the firm appears to be % 50.0% -Select 6.0 Select 3.5 Selecta Se managed Ratios Firm Industry Comment Quick ratio 1.0 -Select- Current ratio 2.7 -Select- 7.0 -Select- Inventory turnover Days sales outstanding Fixed assets turnover days 32 days 13.0 -Select- Poor High -SETS Total assets turnover 2.6 Return on assets % 9.1% -Select- % 18.2% -Select- % 3.5% Select- Return on equity Profit margin on sales Debt-to-assets ratio Liabilities-to-assets ratio % 21.0% -Select- % 50.0% -Select- P/E ratio 6.0 -Select- Market/Book ratio 3.5 -Select- So, the firm appears to be -Select e managed, Ratios Firm Industry Comment Quick ratio 1.0 -Select- e 2.7 -Select- 7.0 -Select- Current ratio Inventory turnover Days sales outstanding Fixed assets turnover Total assets turnover days 32 days -Select- 13.0 2.6 -Select- Poor High -Seredo Return on assets % 9.1% Return on equity % 18.2% Select- % 3.5% -Select- % 21.0% -Select- Profit margin on sales Debt-to-assets ratio Liabilities-to-assets ratio P/E ratio % 50.0% -Select 6.0 -Select Market/Book ratio 3.5 Select- So, the firm appears to be Select managed. Ratios Firm Industry Comment 1.0 -Select- Quick ratio Current ratio 2.7 -Select 7.0 -Selecte Inventory turnover Days sales outstanding Fixed assets turnover days 32 days Select 13.0 -Select- Total assets turnover 2.6 -Select- e Return on assets % 9.1% Select Bad Return on equity % 18.2% % 3.5% Good SC Profit margin on sales Debt-to-assets ratio % 21.0% -Select Liabilities-to-assets ratio % 50.0% -Select- P/E ratio 6.0 -Select- 3.5 -Select- Market/Book ratio So, the firm appears to be Select managed. Ratios Firm Industry Comment 1.0 -Select- 2.7 -Select- Quick ratio Current ratio Inventory turnover Days sales outstanding Fixed assets turnover 7.0 -Select- days 32 days -Select- 13.0 -Selecte Total assets turnover 2.6 -Select- Return on assets % 9.1% -Select- Return on equity % 18.2% Profit margin on sales & -Select- A Bad Good % 3.5% % 21.0% SOT Debt-to-assets ratio Liabilities-to-assets ratio % 50.0% -Select- P/E ratio 6.0 -Select- Market/Book ratio 3.5 -Select- So, the firm appears to be -Select managed. operating Dalance sheet accounts. D Ratios Firm Industry Comment Quick ratio 1.0 -Select- Current ratio 2.7 -Select- 7.0 -Select- days 32 days -Select- 13.0 -Select- Inventory turnover Days sales outstanding Fixed assets turnover Total assets turnover Return on assets Return on equity Profit margin on sales 2.6 -Select- % 9.1% -Select- a % 18.2% -Select- %% 3.5% Select Debt-to-assets ratio Bad % 21.0% Good Liabilities-to-assets ratio % 50.0% PC P/E ratio 6.0 -Select- 3.5 -Select- Market/Book ratio So, the firm appears to be Sal managed Ratios Firm Industry Comment 1.0 -Select- Quick ratio 2.7 -Select- Current ratio 7.0 -Select- Inventory turnover Days sales outstanding Fixed assets tumover days -Select- 32 days 13.0 -Select- 2.6 -Select- Total assets turnover % 9.1% Select % 18.2% -Select- % 3.5% Return on assets Return on equity Profit margin on sales Debt-to-assets ratio Liabilities-to-assets ratio -Select- % 21.0% % 50.0% -Select LOW High SETE 6.0 P/E ratio 3.5 -Select- o Market/Book ratio So, the firm appears to be Select managed. Ratios Firm Industry Comment Quick ratio 1.0 -Select- e Current ratio 2.7 -Select- 7.0 -Select- Inventory turnover Days sales outstanding Fixed assets turnover days 32 days -Select- 13.0 -Select- Total assets turnover 2.6 -Select- Return on assets % 9.1% -Select- Return on equity % 18.2% -Select- Profit margin on sales % 3.5% -Select- % 21.0% Select Debt-to-assets ratio Liabilities-to-assets ratio % 50.0% -Select- P/E ratio 6.0 LOW High SOOS Market/Book ratio 3.5 So, the firm appears to be Select managed. Ratios Firm Industry Comment Quick ratio 1.0 -Select- Current ratio 2.7 -Select- 7.0 -Select- days 32 days -Select- e Inventory turnover Days sales outstanding Fixed assets turnover Total assets turnover 13.0 -Select- 2.6 -Select- Return on assets % 9.1% -Select- % 18.2% -Select- e Return on equity Profit margin on sales % 3.5% Select Debt-to-assets ratio % 21.0% -Select- Liabilities-to-assets ratio % 50.0% -Select- P/E ratio 6.0 Market/Book ratio -Select- Poor High 3.5 So, the firm appears to be Select managed, Ratios Firm Industry Comment Quick ratio 1.0 -Select- Current ratio 2.7 -Select- Inventory turnover 7.0 -Select- days 32 days -Select- e Days sales outstanding Fixed assets turnover 13.0 -Select- Total assets turnover 2.6 Select Return on assets % 9.1% -Select- Return on equity % 18.2% -Select- % 3.5% -Select Profit margin on sales Debt-to-assets ratio Labilities-to-assets ratio % 21.0% Select- % 50.0% -Select- P/E ratio 6.0 Select Market/Book ratio 3.5 Select Poor So, the firm appears to be Select managed High Debt-to-assets ratio % Liabilities-to-assets ratio % P/E ratio Market/Book ratio So, the firm appears to Select-managed. bedly well Jimenez Corporation : Forecasted Balance Sheet as of December 31, 2020


Step by Step Solution
There are 3 Steps involved in it
Step: 1

Get Instant Access to Expert-Tailored Solutions
See step-by-step solutions with expert insights and AI powered tools for academic success
Step: 2

Step: 3

Ace Your Homework with AI
Get the answers you need in no time with our AI-driven, step-by-step assistance
Get Started


