Answered step by step
Verified Expert Solution
Question
1 Approved Answer
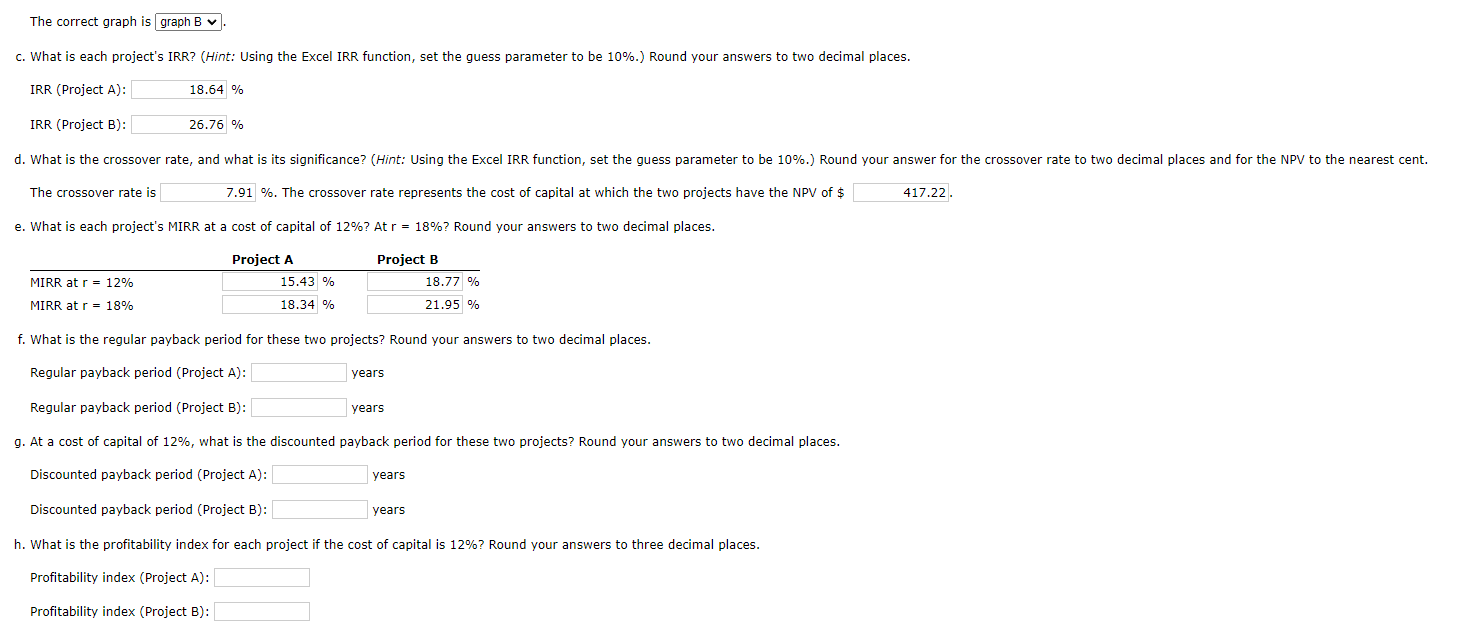
The correct graph is graph B c. What is each project's IRR? (Hint: Using the Excel IRR function, set the guess parameter to be


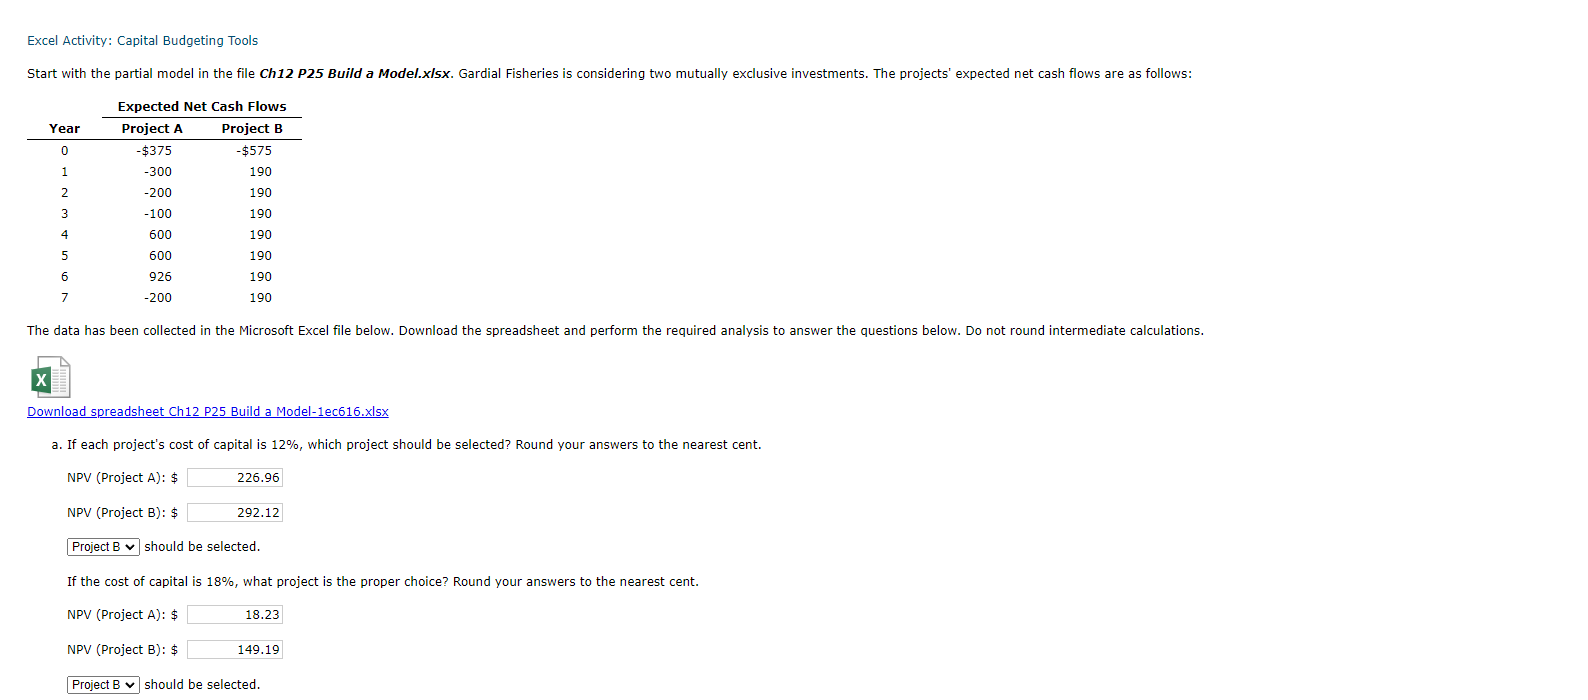
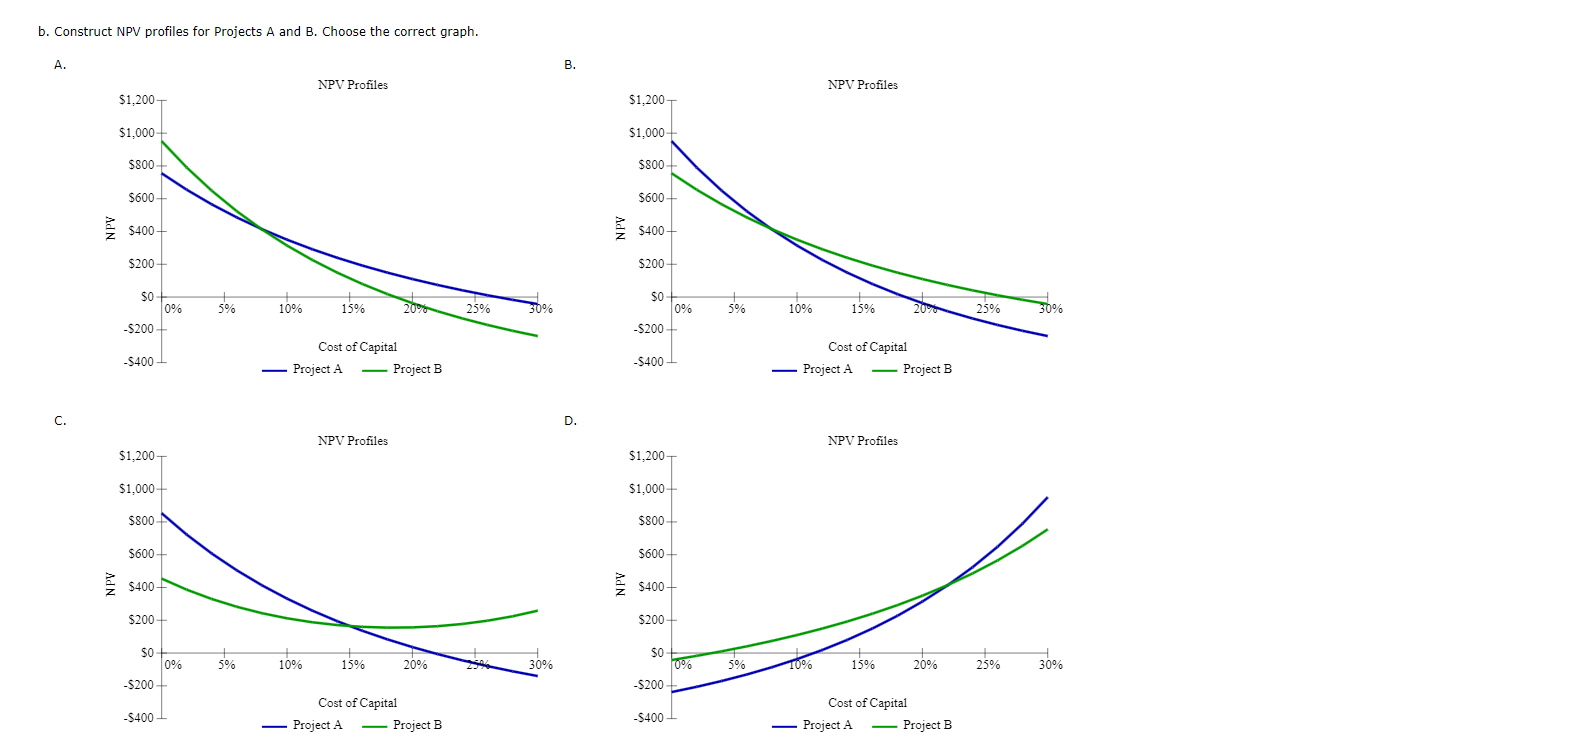
The correct graph is graph B c. What is each project's IRR? (Hint: Using the Excel IRR function, set the guess parameter to be 10%.) Round your answers to two decimal places. IRR (Project A): IRR (Project B): 18.64 % 26.76 % d. What is the crossover rate, and what is its significance? (Hint: Using the Excel IRR function, set the guess parameter to be 10%.) Round your answer for the crossover rate to two decimal places and for the NPV to the nearest cent. The crossover rate is 7.91 %. The crossover rate represents the cost of capital at which the two projects have the NPV of $ e. What is each project's MIRR at a cost of capital of 12%? At r = 18%? Round your answers to two decimal places. 417.22 MIRR at r = 12% MIRR at r = 18% Project A Project B 15.43 % 18.34 % 18.77 % 21.95 % f. What is the regular payback period for these two projects? Round your answers to two decimal places. Regular payback period (Project A): Regular payback period (Project B): years years g. At a cost of capital of 12%, what is the discounted payback period for these two projects? Round your answers to two decimal places. Discounted payback period (Project A): Discounted payback period (Project B): years years h. What is the profitability index for each project if the cost of capital is 12%? Round your answers to three decimal places. Profitability index (Project A): Profitability index (Project B): Excel Activity: Capital Budgeting Tools Start with the partial model in the file Ch12 P25 Build a Model.xlsx. Gardial Fisheries is considering two mutually exclusive investments. The projects' expected net cash flows are as follows: Expected Net Cash Flows Year Project A Project B 0 -$375 -$575 1 -300 190 2 -200 190 3 -100 190 4 600 190 5 600 190 6 7 926 -200 190 190 The data has been collected in the Microsoft Excel file below. Download the spreadsheet and perform the required analysis to answer the questions below. Do not round intermediate calculations. X Download spreadsheet Ch12 P25 Build a Model-1ec616.xlsx a. If each project's cost of capital is 12%, which project should be selected? Round your answers to the nearest cent. NPV (Project A): $ 226.96 NPV (Project B): $ 292.12 Project B should be selected. If the cost of capital is 18%, what project is the proper choice? Round your answers to the nearest cent. NPV (Project A): $ NPV (Project B): $ 18.23 149.19 Project B should be selected. C. b. Construct NPV profiles for Projects A and B. Choose the correct graph. NPV A. NPV Profiles $1,200- $1,000+ $800 $600- $400- $200 $0- 0% 5% 10% 15% 20% 25% -$200 -$400 Cost of Capital Project A Project B NPV Profiles $1,200- $1,000+ $800- 30% B. NPV Profiles $1,200 NPV $1,000- $800- $600- $400- $200 0% 5% 10% 15% 20% 25% 30% -$200 Cost of Capital -$400 Project A Project B D. NPV Profiles $1,200 $1,000- $800 $600- $600- $400 NPV $400 $200 $200 $0 0% 5% 10% 15% 20% 30% 0% 5% 10% 15% 20% 25% 30% -$200 -$200 Cost of Capital Cost of Capital -$400 -$400 Project A Project B Project A Project B
Step by Step Solution
There are 3 Steps involved in it
Step: 1

Get Instant Access to Expert-Tailored Solutions
See step-by-step solutions with expert insights and AI powered tools for academic success
Step: 2

Step: 3

Ace Your Homework with AI
Get the answers you need in no time with our AI-driven, step-by-step assistance
Get Started


