Answered step by step
Verified Expert Solution
Question
1 Approved Answer
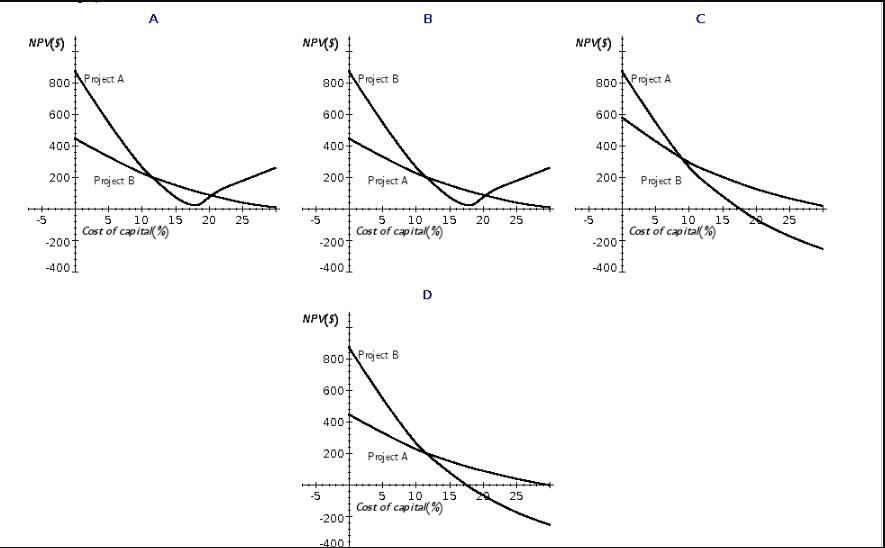
The correct graph is -Select-ABCD . What is each project's IRR? Do not round intermediate calculations. Round your answers to two decimal places. Project A:__


The correct graph is -Select-ABCD .
- What is each project's IRR? Do not round intermediate calculations. Round your answers to two decimal places.
Project A:__ %
Project B:__ % - Calculate the two projects' NPVs, if you were told that each project's cost of capital was 11%. Do not round intermediate calculations. Round your answers to the nearest cent.
Project A: $___
Project B : $___
Which project, if either, should be selected?
Calculate the two projects' NPVs, if the cost of capital was 16%. Do not round intermediate calculations. Round your answers to the nearest cent.
Project A $
Project B $
What would be the proper choice?
- - What is each project's MIRR at a cost of capital of 11%? (Hint: Consider Period 7 as the end of Project B's life.) Do not round intermediate calculations. Round your answers to two decimal places.
Project A %
Project B %
What is each project's MIRR at a cost of capital of 16%? (Hint: Consider Period 7 as the end of Project B's life.) Do not round intermediate calculations. Round your answer to two decimal places.
Project A %
Project B % - What is the crossover rate? Do not round intermediate calculations. Round your answer to two decimal places.
%
What is its significance?
I. The crossover rate has no significance in capital budgeting analysis.
II. If the cost of capital is greater than the crossover rate, both the NPV and IRR methods will lead to the same project selection.
III. If the cost of capital is less than the crossover rate, both the NPV and IRR methods lead to the same project selections.
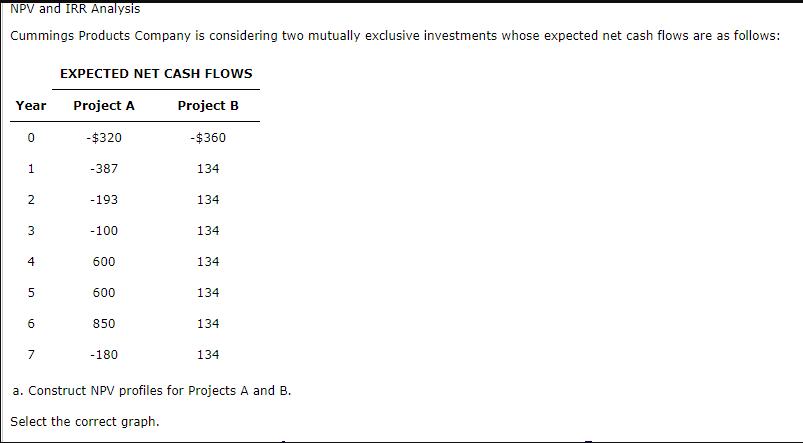
NPV and IRR Analysis Cummings Products Company is considering two mutually exclusive investments whose expected net cash flows are as follows: Year 0 1 2 3 4 5 6 7 EXPECTED NET CASH FLOWS Project A Project B -$360 134 - $320 -387 -193 -100 600 600 850 -180 134 134 134 134 134 134 a. Construct NPV profiles for Projects A and B. Select the correct graph.
Step by Step Solution
★★★★★
3.34 Rating (166 Votes )
There are 3 Steps involved in it
Step: 1
SOLUTION To construct the NPV profiles for Projects A and B we plot the net present value NPV on the yaxis and the cost of capital on the xaxis The NP...
Get Instant Access to Expert-Tailored Solutions
See step-by-step solutions with expert insights and AI powered tools for academic success
Step: 2

Step: 3

Ace Your Homework with AI
Get the answers you need in no time with our AI-driven, step-by-step assistance
Get Started


