

Answered step by step
Verified Expert Solution
Question
1 Approved Answer
The correct graph is . Suppose you hold a large, well-diversified portfolio and are considering adding to that portfolio whether stock X or another stock,
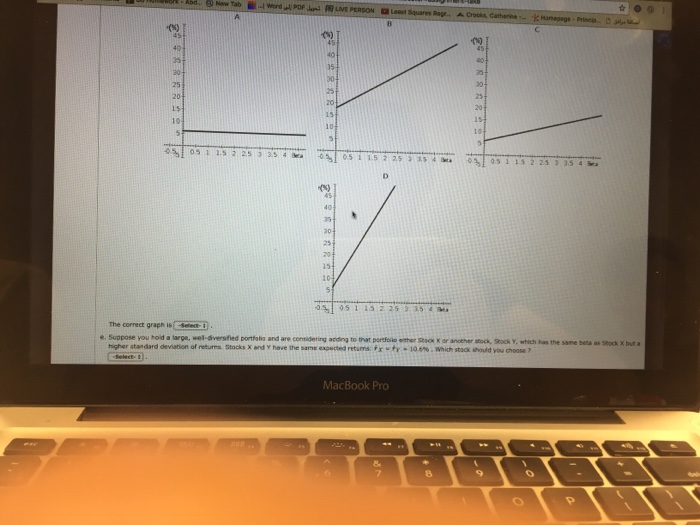 The correct graph is . Suppose you hold a large, well-diversified portfolio and are considering adding to that portfolio whether stock X or another stock, stock Y, which has the same beta as stock X but a higher standard deviation of returns. stocks X and Y have the same expected returns: r vector _x = r vector_y = 10.6%. Which stock should you choose
Step by Step Solution
There are 3 Steps involved in it
Step: 1

Get Instant Access to Expert-Tailored Solutions
See step-by-step solutions with expert insights and AI powered tools for academic success
Step: 2

Step: 3
Ace Your Homework with AI
Get the answers you need in no time with our AI-driven, step-by-step assistance
Get Started
Standards Of Value
Authors: Jay E. Fishman, Shannon P. Pratt, William J. Morrison
2nd Edition
1118138538, 978-1118138533