

Answered step by step
Verified Expert Solution
Question
1 Approved Answer
The csv file house _ price.csv contains the basic information about houses. Read the data from the csv file house _ price.csv ,
The csv file "houseprice.csv contains the basic information about houses. Read the data from the csv file "houseprice.csv and create a dataframe object. Plot the histogram chart and the density chart of the distribution of bedrooms ie the column "bedrooms" Plot the scatter chart of the relationship between the column sqftliving" and the column "price". Plot the bar chart of the average selling price ie the column "price" of houses in different cities ie the column "city" and also compute the standard deviation. Plot the box chart of the selling price ie the column "price" of houses in different cities ie the column "city" In : import pandas as pd import matplotlib. pyplot as plt import seaborn as sns In : # Read the data #file ruth path houseprice. csv In df pd readcsv path df Out : tabledate,price,bedrooms,bathrooms,sqftliving,sqftlot,floors,waterfront,view,condition,sqftabove,sqftbasement,yrbuilt,yrrenovatedtable 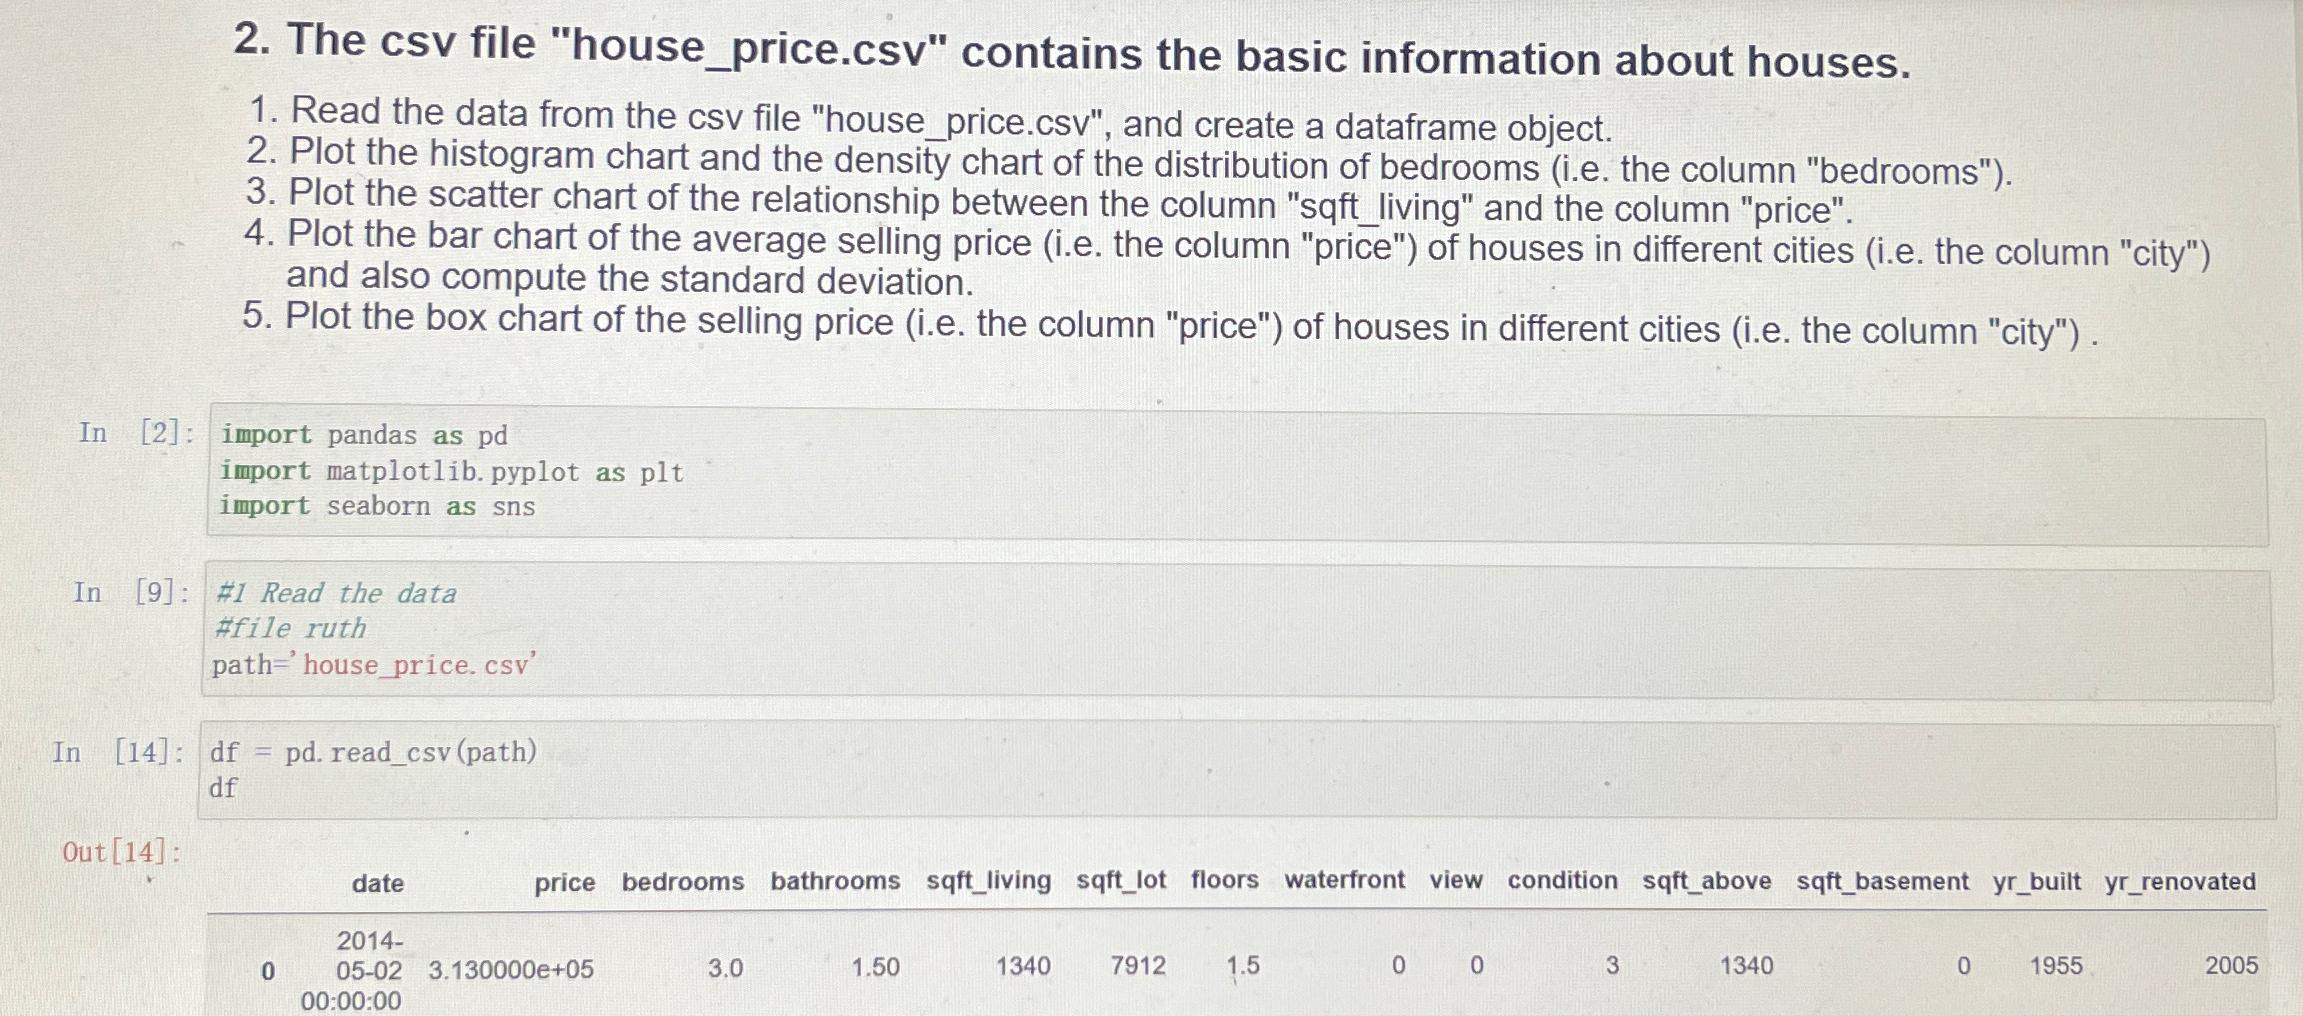
The csv file "houseprice.csv contains the basic information about houses.
Read the data from the csv file "houseprice.csv and create a dataframe object.
Plot the histogram chart and the density chart of the distribution of bedrooms ie the column "bedrooms"
Plot the scatter chart of the relationship between the column sqftliving" and the column "price".
Plot the bar chart of the average selling price ie the column "price" of houses in different cities ie the column "city" and also compute the standard deviation.
Plot the box chart of the selling price ie the column "price" of houses in different cities ie the column "city"
In :
import pandas as pd
import matplotlib. pyplot as plt
import seaborn as sns
In :
# Read the data
#file ruth
path houseprice. csv
In
df pd readcsv path
df
Out :
tabledate,price,bedrooms,bathrooms,sqftliving,sqftlot,floors,waterfront,view,condition,sqftabove,sqftbasement,yrbuilt,yrrenovatedtable
Step by Step Solution
There are 3 Steps involved in it
Step: 1

Get Instant Access to Expert-Tailored Solutions
See step-by-step solutions with expert insights and AI powered tools for academic success
Step: 2

Step: 3
Ace Your Homework with AI
Get the answers you need in no time with our AI-driven, step-by-step assistance
Get Started
User Defined Tensor Data Analysis
Authors: Bin Dong ,Kesheng Wu ,Suren Byna
1st Edition
3030707490, 978-3030707491