

Question
The current year financial statements for Blue Water Company and Prime Fish Company are presented below. Blue Water Prime Fish Balance sheet: Cash $ 42,400
The current year financial statements for Blue Water Company and Prime Fish Company are presented below.
| Blue Water | Prime Fish | ||||||
| Balance sheet: | |||||||
| Cash | $ | 42,400 | $ | 19,600 | |||
| Accounts receivable (net) | 45,000 | 35,200 | |||||
| Inventory | 92,000 | 48,400 | |||||
| Property & equipment (net) | 161,000 | 417,800 | |||||
| Other assets | 85,400 | 319,000 | |||||
| Total assets | $ | 425,800 | $ | 840,000 | |||
| Current liabilities | $ | 92,000 | $ | 70,000 | |||
| Long-term debt (interest rate: 10%) | 74,800 | 62,800 | |||||
| Capital stock ($10 par value) | 157,800 | 526,000 | |||||
| Additional paid-in capital | 30,400 | 107,400 | |||||
| Retained earnings | 70,800 | 73,800 | |||||
| Total liabilities and stockholders equity | $ | 425,800 | $ | 840,000 | |||
| Income statement: | |||||||
| Sales revenue (1/3 on credit) | $ | 426,000 | $ | 788,000 | |||
| Cost of goods sold | (234,000 | ) | (401,400 | ) | |||
| Operating expenses | (163,800 | ) | (312,400 | ) | |||
| Net income | $ | 28,200 | $ | 74,200 | |||
| Other data: | |||||||
| Per share stock price at end of current year | $ | 23.4 | $ | 29 | |||
| Average income tax rate | 30 | % | 30 | % | |||
| Dividends declared and paid in current year | $ | 34,400 | $ | 155,000 | |||
|
| |||||||
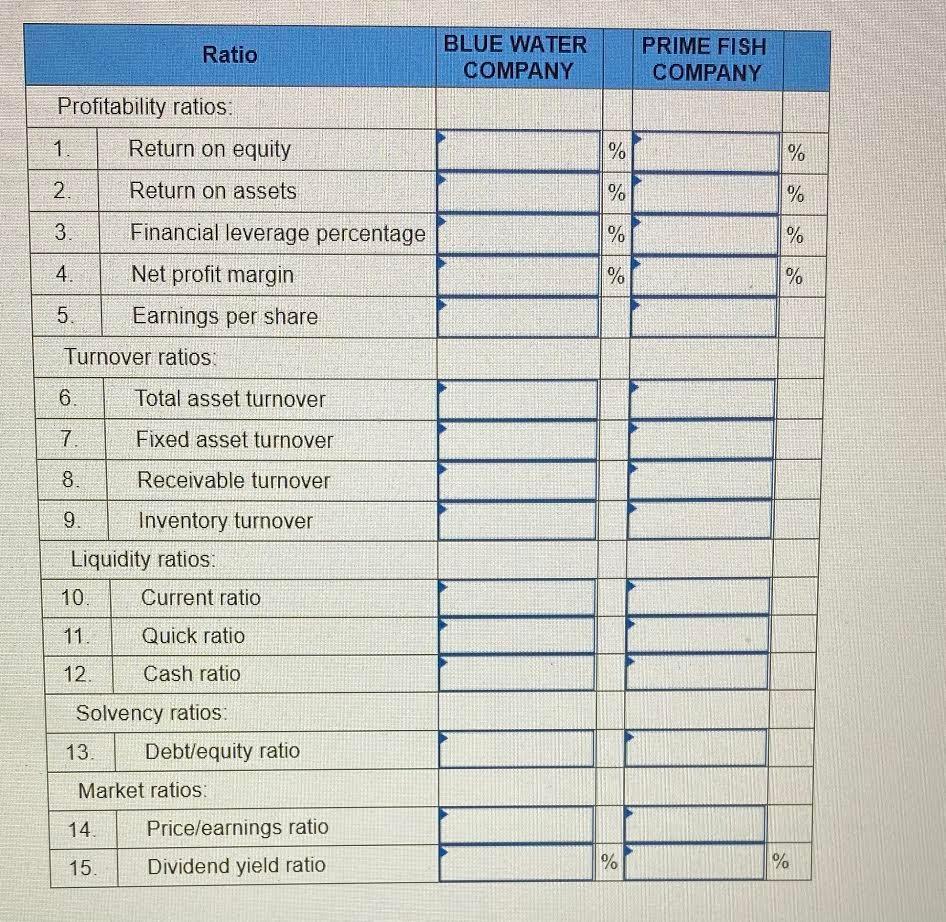
Both companies are in the fish catching and manufacturing business. Both have been in business approximately 10 years, and each has had steady growth. The management of each has a different viewpoint in many respects. Blue Water is more conservative, and as its president has said, We avoid what we consider to be undue risk. Neither company is publicly held. Required:
1. Complete a schedule that reflects a ratio analysis of each company. (Round your intermediate calculations and final answers to 2 decimal places. Enter percentage answers rounded to 2 decimal places (i.e. 0.1234 should be entered as 12.34).)
Step by Step Solution
There are 3 Steps involved in it
Step: 1

Get Instant Access to Expert-Tailored Solutions
See step-by-step solutions with expert insights and AI powered tools for academic success
Step: 2

Step: 3
Ace Your Homework with AI
Get the answers you need in no time with our AI-driven, step-by-step assistance
Get Started
Finding Your Granite My Four Cornerstones Of Personal Leadership Security Audit And Leadership Series
Authors: Douglas P. Pflug
1st Edition
1032034114, 978-1032034119