Question
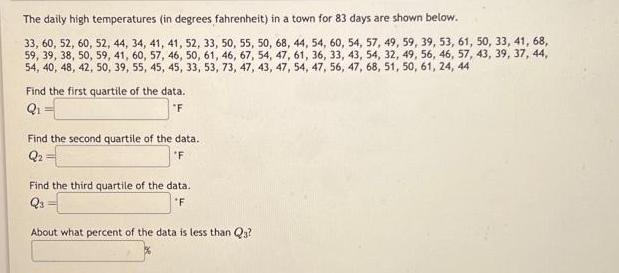
The daily high temperatures (in degrees fahrenheit) in a town for 83 days are shown below. 33, 60, 52, 60, 52, 44, 34, 41,

The daily high temperatures (in degrees fahrenheit) in a town for 83 days are shown below. 33, 60, 52, 60, 52, 44, 34, 41, 41, 52, 33, 50, 55, 50, 68, 44, 54, 60, 54, 57, 49, 59, 39, 53, 61, 50, 33, 41, 68, 59, 39, 38, 50, 59, 41, 60, 57, 46, 50, 61, 46, 67, 54, 47, 61, 36, 33, 43, 54, 32, 49, 56, 46, 57, 43, 39, 37, 44, 54, 40, 48, 42, 50, 39, 55, 45, 45, 33, 53, 73, 47, 43, 47, 54, 47, 56, 47, 68, 51, 50, 61, 24, 44 Find the first quartile of the data. Q "F Find the second quartile of the data. Q *F Find the third quartile of the data. Q3 *F About what percent of the data is less than Qa?
Step by Step Solution
3.40 Rating (163 Votes )
There are 3 Steps involved in it
Step: 1
The data in ascending order 24 32 33 33 33 34 36 37 38 39 39 39 40 41 41 41 42 43 43 43 44 44 44 45 ...
Get Instant Access to Expert-Tailored Solutions
See step-by-step solutions with expert insights and AI powered tools for academic success
Step: 2

Step: 3

Ace Your Homework with AI
Get the answers you need in no time with our AI-driven, step-by-step assistance
Get StartedRecommended Textbook for
Complete Business Statistics
Authors: Amir Aczel, Jayavel Sounderpandian
7th Edition
9780071077903, 73373605, 71077901, 9780073373607, 77239695, 978-0077239695
Students also viewed these Mathematics questions
Question
Answered: 1 week ago
Question
Answered: 1 week ago
Question
Answered: 1 week ago
Question
Answered: 1 week ago
Question
Answered: 1 week ago
Question
Answered: 1 week ago
Question
Answered: 1 week ago
Question
Answered: 1 week ago
Question
Answered: 1 week ago
Question
Answered: 1 week ago
Question
Answered: 1 week ago
Question
Answered: 1 week ago
Question
Answered: 1 week ago
Question
Answered: 1 week ago
Question
Answered: 1 week ago
Question
Answered: 1 week ago
Question
Answered: 1 week ago
Question
Answered: 1 week ago
Question
Answered: 1 week ago
Question
Answered: 1 week ago
Question
Answered: 1 week ago
Question
Answered: 1 week ago
View Answer in SolutionInn App


