

Question
The data below is for weekly sales of boxed foods in the dry goods department at a WalMart store in the Northeast. Dollar values are
The data below is for weekly sales of boxed foods in the dry goods department at a WalMart store in the Northeast. Dollar values are adjusted in order to disguise true sales figure, but trends in the data are retained for analysis purposes. WalMart's fiscal year starts the first week of February, therefore Week 1 is the first week of February 2002. To show continuity, 52 weeks are added to 2003 actual weekly data. This means that when analyzing the data, week 26 is calendar week 30 (26+4 weeks for January) in 2002 or the end of July 2002.Also, week 52 is calendar week 4 (52+4 weeks for January 2002 minus 52 weeks for 2002) in 2003 or the end of January 2003. Outliers (extreme values) are present in the data and can distort modeling results. As an example, spikes in sales (revenue) at weeks 28-30 occurs in weeks 32-34 (28+4 and 30+4) which represent mid to late August 2002. Another spike at week 58 week is actually week 10 in 2003 (58+4 weeks for Jan. 2002 minus 52 weeks for 2002). This corresponds to sales for early March 2003. The question is are these spikes due to special events / holiday periods, or are perhaps due to restocking & stock availability.
Each model is to be supported by appropriate data plots, graphs, mathematical computations and explanations where needed showing all work. Spikes in the data are outliers and major ones should normally be considered and removed from the data to clean and ensure a better model as part of your option to differentiate results. Generate supporting Excel graphs (use scatter plots) to answer the following questions for the Dry Goods 2002-2003 data. The Dry Goods 2002-2003 data was provided in a separate Excel file. Provide proper labeling of the axes in the graphs when used in context to your analysis. 1. Identify spikes (outliers) in the data where extreme sales values occur and correlate these spikes with actual calendar dates in 2002 or 2003 and with events that may occur during these periods. Present your result in a table format as follows: Week # Calendar dates associated with week # Special holiday or event Spike Sales Value ($)
2. Modeling the data linearly -
a. Generate a linear model for this data by choosing two points.
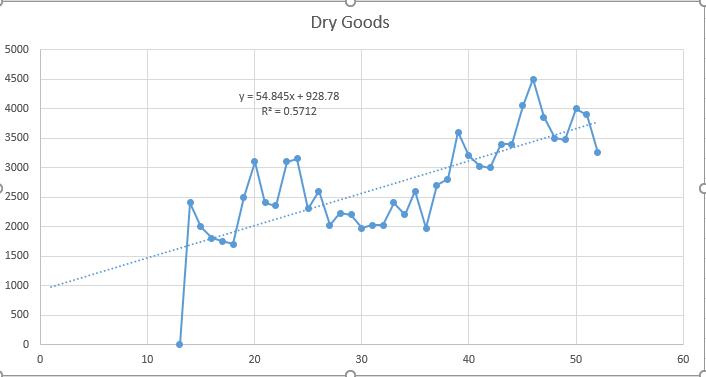
b. Generate a least squares linear regression model for this data.
c. How good is this regression model? Discuss how the model output compares to actual data and discuss the R2 value
d. What are the marginal sales (derivative, i.e. rate of change) for this department using the linear model with two data points and the regression model?
e. Compare the two models. Which do you feel is better?
f. Remove appropriate outliers as you deem necessary and rerun the linear regression model. What is the marginal sales and discuss improvements.
3. Modeling the data quadratically -
a. Generate a quadratic model for this data. Discuss how the model output compares to actual data and discuss the R2 value.
b. What are the marginal sales for this department using this model?
c. Calculate the model generated relative max/min value. Show backup analytical work.
d. Compare actual and model generated relative max/min value. e. Remove outliers and rerun the quadratic least squares model. What is the marginal sales and discuss improvements.
There should be a discussion of the results of a good model based on the R2 value for least squares models, marginal sales (rates of change of the sales models) and their meanings for the various models generated, along with discussion around the questions listed below. 4. Comparing models a. Based on all models run, which model do you feel best predicts future trends? Explain your rationale. b. Based on the model selected, what type of seasonal adjustments, if any, would be required to meet customer needs?
Boxed Foods 2002-2003 Data Week | Sales in $ 26 | 2400 27 | 2000 28 | 1800 29 | 1750 30 | 1700 31 | 2500 32 | 3100 33 | 2400 34 | 2350 35 | 3100 36 | 3150 37 | 2300 38 | 2600 39 | 2025 40 | 2225 41 | 2200 42 | 1975 43 | 2025 44 | 2025 45 | 2400 46 | 2200 47 | 2600 48 | 1975 49 | 2700 50 | 2800 51 | 3600 52 | 3200 53 | 3025 54 | 3000 55 | 3400 56 | 3400 57 | 4050 58 | 4500 59 | 3850 60 | 3500 61 | 3475 62 | 4000 63 | 3900 64 | 3250 65 | 3600 66 | 4500 67 | 3600 68 | 4100 69 | 4300 70 | 4600 71 | 3950 72 | 4300 73 | 4300 74 | 4225 75 | 3975 76 | 4600 77 | 4300
Step by Step Solution
There are 3 Steps involved in it
Step: 1

Get Instant Access to Expert-Tailored Solutions
See step-by-step solutions with expert insights and AI powered tools for academic success
Step: 2

Step: 3
Ace Your Homework with AI
Get the answers you need in no time with our AI-driven, step-by-step assistance
Get Started
Management
Authors: Chuck Williams
4th Edition
978-0324316797, 0324316798