

Question
The data below represent commute times (in minutes) and scores on a well-being survey. Complete parts (a) through (d) below. Commute Time (minutes), x 5
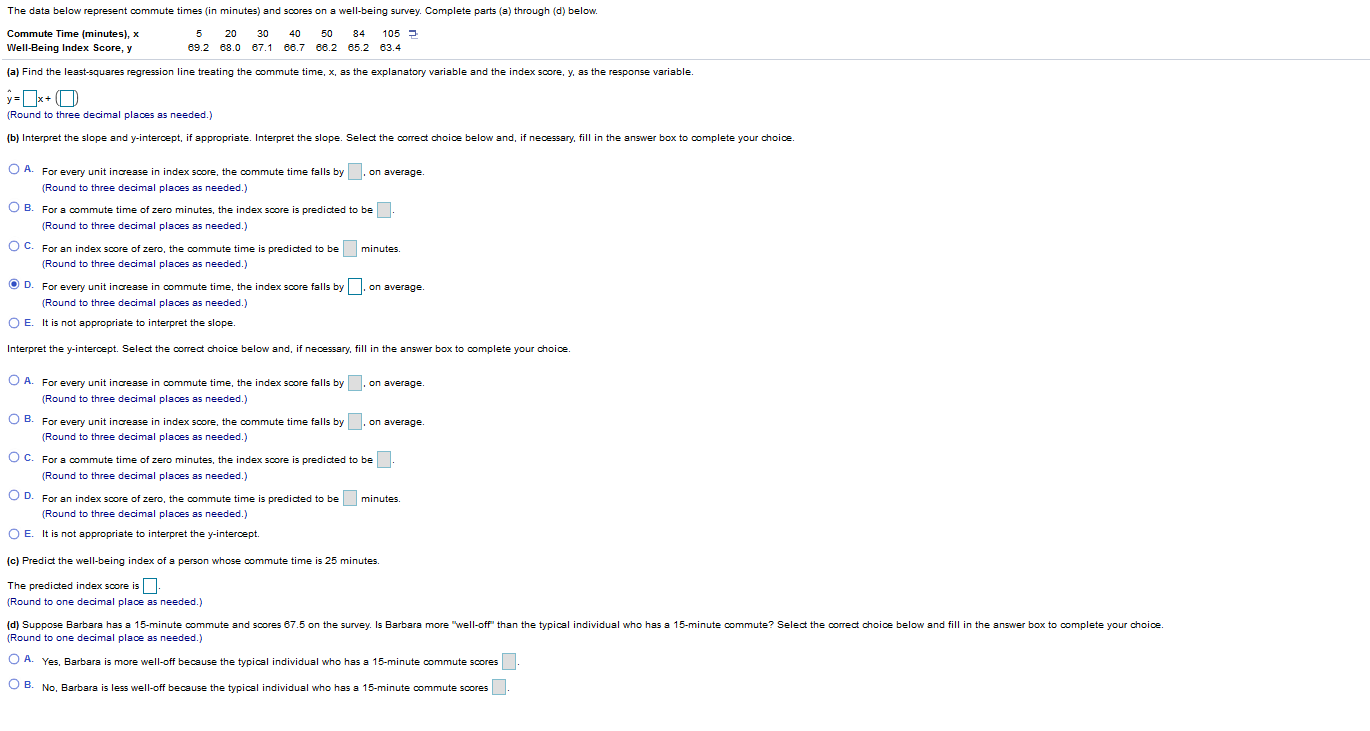
The data below represent commute times (in minutes) and scores on a well-being survey. Complete parts (a) through (d) below.
Commute Time (minutes), x
5
20
30
40
50
84
105
Well-Being Index Score, y
69.2
68.0
67.1
66.7
66.2
65.2
63.4
(a) Find the least-squares regression line treating the commute time, x, as the explanatory variable and the index score, y, as the response variable.
Step by Step Solution
There are 3 Steps involved in it
Step: 1

Get Instant Access to Expert-Tailored Solutions
See step-by-step solutions with expert insights and AI powered tools for academic success
Step: 2

Step: 3
Ace Your Homework with AI
Get the answers you need in no time with our AI-driven, step-by-step assistance
Get Started
Contemporary Business Mathematics With Canadian Applications
Authors: Ali R. Hassanlou, S. A. Hummelbrunner, Kelly Halliday
12th Edition
0135285011, 978-0135285015