

Question
The data below represent the length in miles of a random sample of tornadoes in a specific area This length represents the number of miles

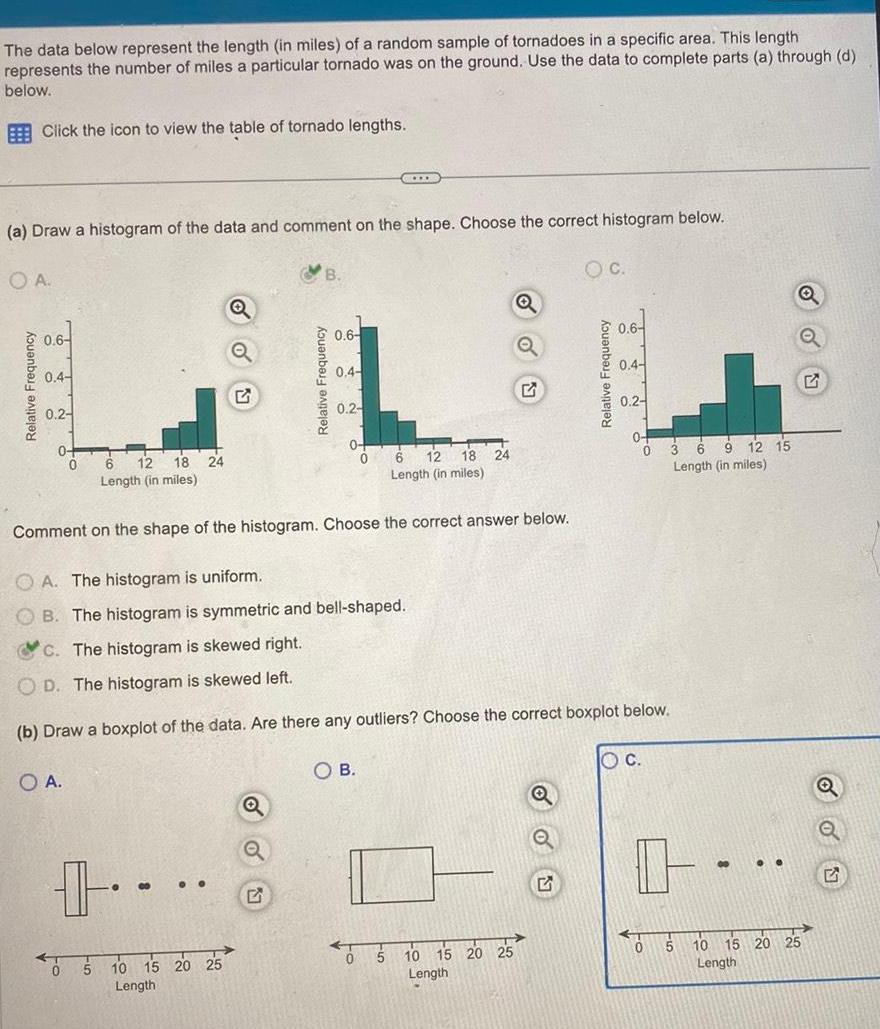
The data below represent the length in miles of a random sample of tornadoes in a specific area This length represents the number of miles a particular tornado was on the ground Use the data to complete parts a through d below Click the icon to view the table of tornado lengths a Draw a histogram of the data and comment on the shape Choose the correct histogram below O C OA Relative Frequency 0 6 0 4 0 2 0 6 12 18 24 Length in miles 11 00 Q G 0 5 10 15 20 25 Length Relative Frequenc 0 6 Q Q 0 4 6 12 Length in miles Comment on the shape of the histogram Choose the correct answer below 0 2 CLXX A The histogram is uniform OB The histogram is symmetric and bell shaped C The histogram is skewed right OD The histogram is skewed left b Draw a boxplot of the data Are there any outliers Choose the correct boxplot below O A OB 0 18 24 5 O OU 10 15 20 25 Length Relative Frequency G 0 4 0 2 OC 9 12 15 Length in miles 00 0 5 10 15 20 25 Length
Step by Step Solution
There are 3 Steps involved in it
Step: 1

Get Instant Access to Expert-Tailored Solutions
See step-by-step solutions with expert insights and AI powered tools for academic success
Step: 2

Step: 3
Ace Your Homework with AI
Get the answers you need in no time with our AI-driven, step-by-step assistance
Get Started
Elementary Differential Geometry
Authors: Barrett O'Neill
1st Edition
148326811X, 9781483268118