Question
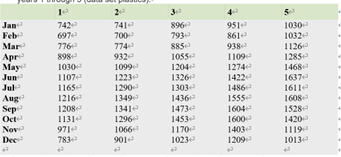
The data below represent the monthly sales (in thousands) of product A for a plastics manufacturer for years 1 through 5 (data set plastics). Use
The data below represent the monthly sales (in thousands) of product A for a plastics manufacturer for years 1 through 5 (data set plastics).

Use fpp2 and fpp in R
1.Plot the time series of sales of product A. Can you identify seasonal fluctuations and/or a trend? (Short answer)
2.Use a classical multiplicative decomposition to calculate the trend-cycle and seasonal indices. Multiple choice: trend component changes approximately in the interval:
(1) From 1000 to 1300 (2) From 1200 to 1500 (3) From 900 to 1400 (4) From 500 to 1100
3.Do the results support the graphical interpretation from part (a)? What are the patterns of the seasonal component, does it need a log of Box-Cox transform before ARIMA forecasting (Short answer)?
4.Compute and plot the seasonally adjusted data.
Multiple choice:
The value of seasonally adjusted data for February year 1 is
(1) 981.2262 (2) 982.7262 (3) 983.6262 (4) 1215.9647
5.
Change one observation to be an outlier (add 500 to one observation 31), and recompute the seasonally adjusted data. What is the effect of the outlier?
Multiple choice:
Jump in seasonal series is closer to
(1) 250 (2) 500 (3) 100 (4) 400
6
Does it make any difference if the outlier is near the end rather than in the middle of the time series (add 500 to records 59)?
Multiple choice:
Jump in seasonal series is closer to
(1) 250 (2) 400 (3) 300 (4) 100
7.
Use a random walk with drift to produce forecasts of the seasonally adjusted data.
Multiple choice:
The forecasted value for July of year 7 is
(1) 1279.173 (2) 1274.167 (3) 1278.345 (4) 1296.028
8.
Reseasonalize the results to give forecasts on the original scale.
Multiple choice:
The forecasted value for December 7th year ahead is
11480.8183 (2) 1306.2335 (3) 1340.6784 (4) 1479.4369
Step by Step Solution
There are 3 Steps involved in it
Step: 1

Get Instant Access to Expert-Tailored Solutions
See step-by-step solutions with expert insights and AI powered tools for academic success
Step: 2

Step: 3

Ace Your Homework with AI
Get the answers you need in no time with our AI-driven, step-by-step assistance
Get Started


