the data for the answer is given in the bottom.
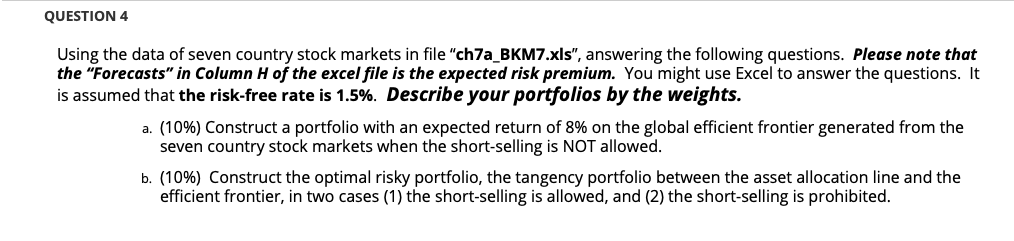
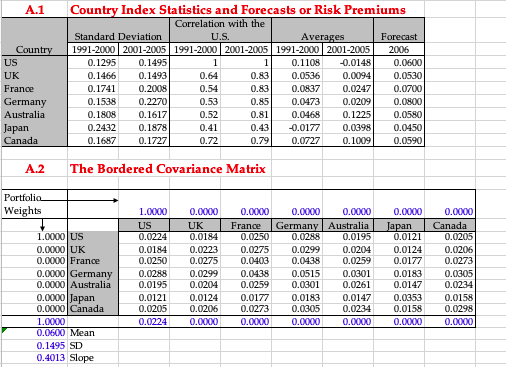
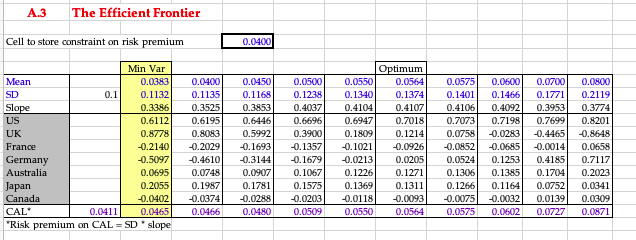
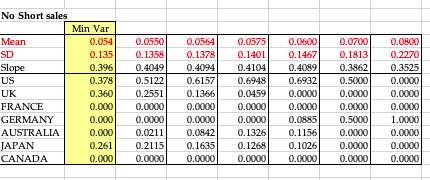
QUESTION 4 Using the data of seven country stock markets in file "ch7a_BKM7.xls", answering the following questions. Please note that the "Forecasts in Column H of the excel file is the expected risk premium. You might use Excel to answer the questions. It is assumed that the risk-free rate is 1.5%. Describe your portfolios by the weights. a. (10%) Construct a portfolio with an expected return of 8% on the global efficient frontier generated from the seven country stock markets when the short-selling is NOT allowed. b. (10%) Construct the optimal risky portfolio, the tangency portfolio between the asset allocation line and the efficient frontier, in two cases (1) the short-selling is allowed, and (2) the short-selling is prohibited. A.1 1 Country US UK France Germany Australia Japan Canada Country Index Statistics and Forecasts or Risk Premiums Correlation with the Standard Deviation U.S. Averages Forecast 1991-2000 2001-2005 1991-2000 2001-2005 1991-2000 2001-2005 2006 0.1295 0.1495 1 0.1108 -0.0148 0.0600 0.1466 0.1493 0.64 0.83 0.0536 0.0094 0.0530 0.1741 0.2008 0.54 0.83 0.0837 0.0247 0.07001 0.1538 0.2270 0.53 0.85 0.0473 0.0209 0.0800 0.1808 0.1617 0.52 0.81 0.0468 0.1225 0.0580 0.2432 0.1878 0.41 0.43 -0.0177 0.0398 0.0450 0.1687 0.1727 0.72 0.79 0.0727 0.1009 0.05901 A.2 The Bordered Covariance Matrix Portfolio Weights 1.0000 US 0.0000 UK 0.0000 France 0.0000 Germany 0.0000Australia 0.0000 Japan 0.0000Canada 1.0X0 0.0600 Mean 0.1495 SD 0.4013 Slope 1.000 US 0.0224 0.0184 0.0250 0.0288 0.0195 0.0121 0.0205 0.0224 0.000 UK 0.0184 0.0223 0.0275 0.0299 0.0204 0.0124 0.0206 0.0000 0.0000 France 0.0250 0.0275 0.0403 0.0438 0.0259 0.0177 0.0273 0.0000 0.000 0.0000 Germany Australia 0.0288 0.0195 0.0299 0.0204 0.0438 0.0259 0.0515 0.0301 0.0301 0.0261 0.0183 0.0147 0.0305 0.0234 0.0000 0.0000 0.0XXX Japan 0.0121 0.0124 0.0177 0.0183 0.0147 0.0353 0.0158 0.0000 0.0000 Canada 0.0205 0.0206 0.0273 0.0305 0.0234 0.0158 0.0298 0.0000 A.3 The Efficient Frontier Cell to store constraint on risk premium 0.0400 Min Var Mean 0.0383 SD 0.1 0.1132 Slope 0.3386 US 0.6112 UK 0.8778 France -0.2140 Germany -0.5097 Australia 0.0695 Japan 0.2055 Canada -0.0402 CAL" 0.0411 0.0465 "Risk premium on CAL = SD slope 0.0400 0.1135 0.3525 0.6195 0.8083 -0.2029 -0.4610 0.0748 0.1987 -0.0374 0.0466 0.0450 0.1168 0.3853 0.6446 0.5992 -0.1693 -0.3144 0.0907 0.1781 -0.0288 0.0480 0.0500 0.1238 0.4037 0.6696 0.3900 -0.1357 -0.1679 0.1067 0.1575 -0.0203 0.0509 0.0550 0.1340 0.4104 0.6947 0.1809 -0.1021 -0.0213 0.1226 0.1369 -0.0118 0.0550 Optimum 0.0564 0.1374 0.4107 0.7018 0.1214 -0.0926 0.0205 0.1271 0.1311 -0.0093 0.0564 0.0575 0.1401 0.4106 0.7073 0.0758 -0.0852 0.0524 0.1306 0.1266 -0.0075 0.0575 0.0600 0.1466 0.4092 0.7198 -0.0283 -0.0685 0.1253 0.1385 0.1164 -0.0032 0.0602 0.0700 0.1771 0.3953 0.7699 -0.4465 -0.0014 0.4185 0.1704 0.0752 0.0139 0.0727 0.0800 0.2119 0.3774 0.8201 -0.8648 0.0658 0.7117 0.2023 0.0341 0.0309 0.0871 No Short sales Min Var Mean 0.054 SD 0.135 Slope 0.396 US 0.378 UK 0.360 FRANCE 0.000 GERMANY 0.000 AUSTRALIA 0.000 JAPAN 0.261 CANADA 0.000 0.0550 0.1358 0.4049 0.5122 0.2551 0.0000 0.0000 0.0211 0.2115 0.0000 0.0564 0.1378 0.4094 0.6157 0.1366 0.0000 0.0000 0.0842 0.1635 0.0000 0.0575 0.1401 0.4104 0.6948 0.0459 0.0000 0.00001 0.1326 0.1268 0.0000 0.06001 0.1467 0.4089 0.6932 0.0000 0.0000 0.0885 0.1156 0.1026 0.0000 0.0700 0.1813 0.3862 0.5000 0.0000 0.0000 0.5000 0.0000 0.0000 0.0000 0.0800 0.2270 0.3525 0.0000 0.0000 0.0000 1.0000 0.0000 0.0000 0.0000 QUESTION 4 Using the data of seven country stock markets in file "ch7a_BKM7.xls", answering the following questions. Please note that the "Forecasts in Column H of the excel file is the expected risk premium. You might use Excel to answer the questions. It is assumed that the risk-free rate is 1.5%. Describe your portfolios by the weights. a. (10%) Construct a portfolio with an expected return of 8% on the global efficient frontier generated from the seven country stock markets when the short-selling is NOT allowed. b. (10%) Construct the optimal risky portfolio, the tangency portfolio between the asset allocation line and the efficient frontier, in two cases (1) the short-selling is allowed, and (2) the short-selling is prohibited. A.1 1 Country US UK France Germany Australia Japan Canada Country Index Statistics and Forecasts or Risk Premiums Correlation with the Standard Deviation U.S. Averages Forecast 1991-2000 2001-2005 1991-2000 2001-2005 1991-2000 2001-2005 2006 0.1295 0.1495 1 0.1108 -0.0148 0.0600 0.1466 0.1493 0.64 0.83 0.0536 0.0094 0.0530 0.1741 0.2008 0.54 0.83 0.0837 0.0247 0.07001 0.1538 0.2270 0.53 0.85 0.0473 0.0209 0.0800 0.1808 0.1617 0.52 0.81 0.0468 0.1225 0.0580 0.2432 0.1878 0.41 0.43 -0.0177 0.0398 0.0450 0.1687 0.1727 0.72 0.79 0.0727 0.1009 0.05901 A.2 The Bordered Covariance Matrix Portfolio Weights 1.0000 US 0.0000 UK 0.0000 France 0.0000 Germany 0.0000Australia 0.0000 Japan 0.0000Canada 1.0X0 0.0600 Mean 0.1495 SD 0.4013 Slope 1.000 US 0.0224 0.0184 0.0250 0.0288 0.0195 0.0121 0.0205 0.0224 0.000 UK 0.0184 0.0223 0.0275 0.0299 0.0204 0.0124 0.0206 0.0000 0.0000 France 0.0250 0.0275 0.0403 0.0438 0.0259 0.0177 0.0273 0.0000 0.000 0.0000 Germany Australia 0.0288 0.0195 0.0299 0.0204 0.0438 0.0259 0.0515 0.0301 0.0301 0.0261 0.0183 0.0147 0.0305 0.0234 0.0000 0.0000 0.0XXX Japan 0.0121 0.0124 0.0177 0.0183 0.0147 0.0353 0.0158 0.0000 0.0000 Canada 0.0205 0.0206 0.0273 0.0305 0.0234 0.0158 0.0298 0.0000 A.3 The Efficient Frontier Cell to store constraint on risk premium 0.0400 Min Var Mean 0.0383 SD 0.1 0.1132 Slope 0.3386 US 0.6112 UK 0.8778 France -0.2140 Germany -0.5097 Australia 0.0695 Japan 0.2055 Canada -0.0402 CAL" 0.0411 0.0465 "Risk premium on CAL = SD slope 0.0400 0.1135 0.3525 0.6195 0.8083 -0.2029 -0.4610 0.0748 0.1987 -0.0374 0.0466 0.0450 0.1168 0.3853 0.6446 0.5992 -0.1693 -0.3144 0.0907 0.1781 -0.0288 0.0480 0.0500 0.1238 0.4037 0.6696 0.3900 -0.1357 -0.1679 0.1067 0.1575 -0.0203 0.0509 0.0550 0.1340 0.4104 0.6947 0.1809 -0.1021 -0.0213 0.1226 0.1369 -0.0118 0.0550 Optimum 0.0564 0.1374 0.4107 0.7018 0.1214 -0.0926 0.0205 0.1271 0.1311 -0.0093 0.0564 0.0575 0.1401 0.4106 0.7073 0.0758 -0.0852 0.0524 0.1306 0.1266 -0.0075 0.0575 0.0600 0.1466 0.4092 0.7198 -0.0283 -0.0685 0.1253 0.1385 0.1164 -0.0032 0.0602 0.0700 0.1771 0.3953 0.7699 -0.4465 -0.0014 0.4185 0.1704 0.0752 0.0139 0.0727 0.0800 0.2119 0.3774 0.8201 -0.8648 0.0658 0.7117 0.2023 0.0341 0.0309 0.0871 No Short sales Min Var Mean 0.054 SD 0.135 Slope 0.396 US 0.378 UK 0.360 FRANCE 0.000 GERMANY 0.000 AUSTRALIA 0.000 JAPAN 0.261 CANADA 0.000 0.0550 0.1358 0.4049 0.5122 0.2551 0.0000 0.0000 0.0211 0.2115 0.0000 0.0564 0.1378 0.4094 0.6157 0.1366 0.0000 0.0000 0.0842 0.1635 0.0000 0.0575 0.1401 0.4104 0.6948 0.0459 0.0000 0.00001 0.1326 0.1268 0.0000 0.06001 0.1467 0.4089 0.6932 0.0000 0.0000 0.0885 0.1156 0.1026 0.0000 0.0700 0.1813 0.3862 0.5000 0.0000 0.0000 0.5000 0.0000 0.0000 0.0000 0.0800 0.2270 0.3525 0.0000 0.0000 0.0000 1.0000 0.0000 0.0000 0.0000