

Answered step by step
Verified Expert Solution
Question
1 Approved Answer
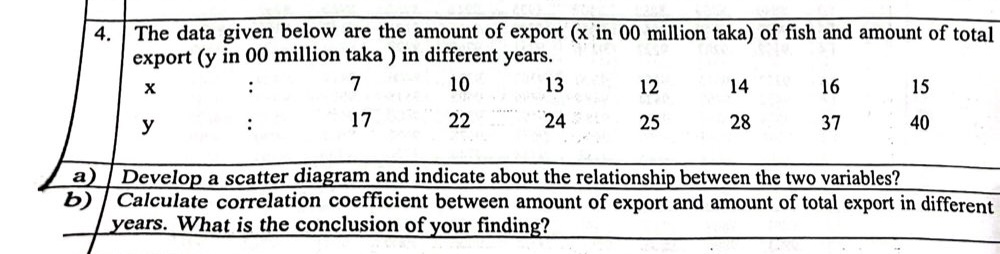
The data given below are the amount of export ( x in 0 0 million taka ) of fish and amount of total export (
The data given below are the amount of export x in million taka of fish and amount of total export y in million taka in different years.
:
:
a
b
Develop a scatter diagram and indicate about the relationship between the two variables?
Calculate correlation coefficient between amount of export and amount of total export in different years. What is the conclusion of your finding?
Step by Step Solution
There are 3 Steps involved in it
Step: 1

Get Instant Access to Expert-Tailored Solutions
See step-by-step solutions with expert insights and AI powered tools for academic success
Step: 2

Step: 3
Ace Your Homework with AI
Get the answers you need in no time with our AI-driven, step-by-step assistance
Get Started
Elementary Statisitcs
Authors: Barry Monk
2nd edition
1259345297, 978-0077836351, 77836359, 978-1259295911, 1259295915, 978-1259292484, 1259292487, 978-1259345296