Answered step by step
Verified Expert Solution
Link Copied!

Question

1 Approved Answer

The data given below show the number of overtime hours worked in one week per employee. Use the data to complete K parts (a) and
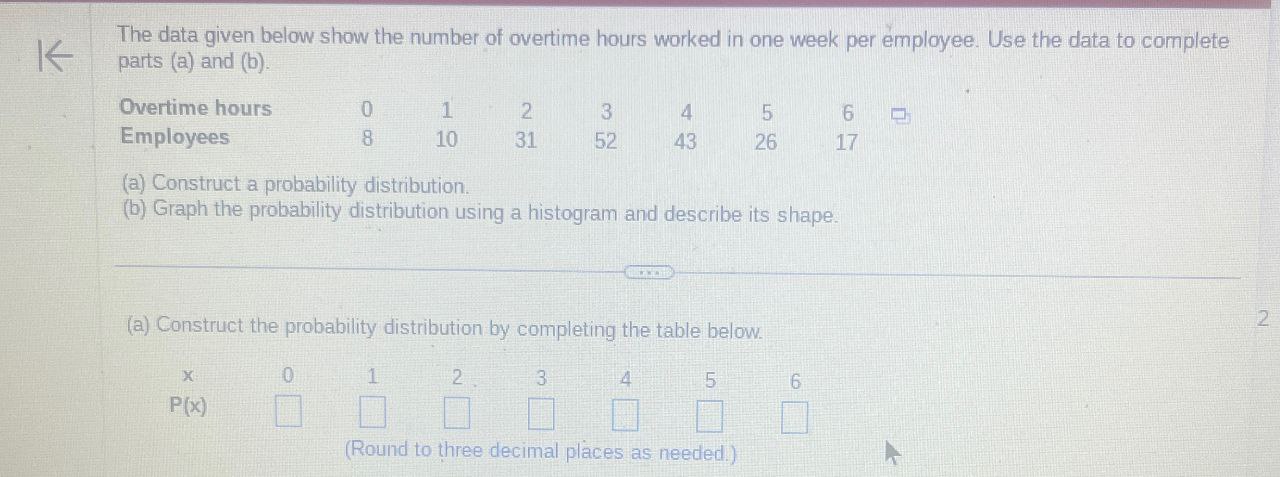
image text in transcribed
The data given below show the number of overtime hours worked in one week per employee. Use the data to complete K parts (a) and (b) Overtime hours 1 2 3 4 5 6 Employees 8 10 31 52 43 26 17 (a) Construct a probability distribution. (b) Graph the probability distribution using a histogram and describe its shape. 2 (a) Construct the probability distribution by completing the table below. X 0 2 3 5 6 P(x) (Round to three decimal places as needed.)

Step by Step Solution

There are 3 Steps involved in it

Step: 1

blur-text-image

Get Instant Access to Expert-Tailored Solutions

See step-by-step solutions with expert insights and AI powered tools for academic success

Step: 2

blur-text-image

Step: 3

blur-text-image

Ace Your Homework with AI

Get the answers you need in no time with our AI-driven, step-by-step assistance

Get Started

Recommended Textbook for

An Introduction to the Mathematics of financial Derivatives

Authors: Salih N. Neftci

2nd Edition

978-0125153928, 9780080478647, 125153929, 978-0123846822

More Books

Students also viewed these Mathematics questions