Answered step by step
Verified Expert Solution
Question
1 Approved Answer
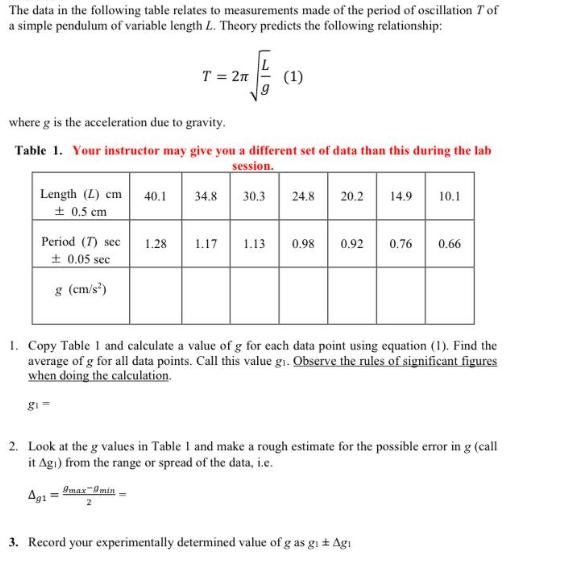
The data in the following table relates to measurements made of the period of oscillation T of a simple pendulum of variable length L.

The data in the following table relates to measurements made of the period of oscillation T of a simple pendulum of variable length L. Theory predicts the following relationship: T = 2 (1) where g is the acceleration due to gravity. Table 1. Your instructor may give you a different set of data than this during the lab session. Length (L) cm 40.1 0.5 cm 34.8 30.3 24.8 20.2 14.9 10.1 Period (7) sec 1.28 1.17 1.13 0.98 0.92 0.76 0.66 0.05 sec g (cm/s) 1. Copy Table 1 and calculate a value of g for each data point using equation (1). Find the average of g for all data points. Call this value gi. Observe the rules of significant figures when doing the calculation. 2. Look at the g values in Table 1 and make a rough estimate for the possible error in g (call it Agi) from the range or spread of the data, i.e. Agi= Imax min 3. Record your experimentally determined value of g as gi Agi
Step by Step Solution
★★★★★
3.40 Rating (159 Votes )
There are 3 Steps involved in it
Step: 1
answer T 20 72 4 L 18 47722 T2 Length L cm 401 348 T s 128 117 113 ...
Get Instant Access to Expert-Tailored Solutions
See step-by-step solutions with expert insights and AI powered tools for academic success
Step: 2

Step: 3

Ace Your Homework with AI
Get the answers you need in no time with our AI-driven, step-by-step assistance
Get Started


