

Answered step by step
Verified Expert Solution
Question
1 Approved Answer
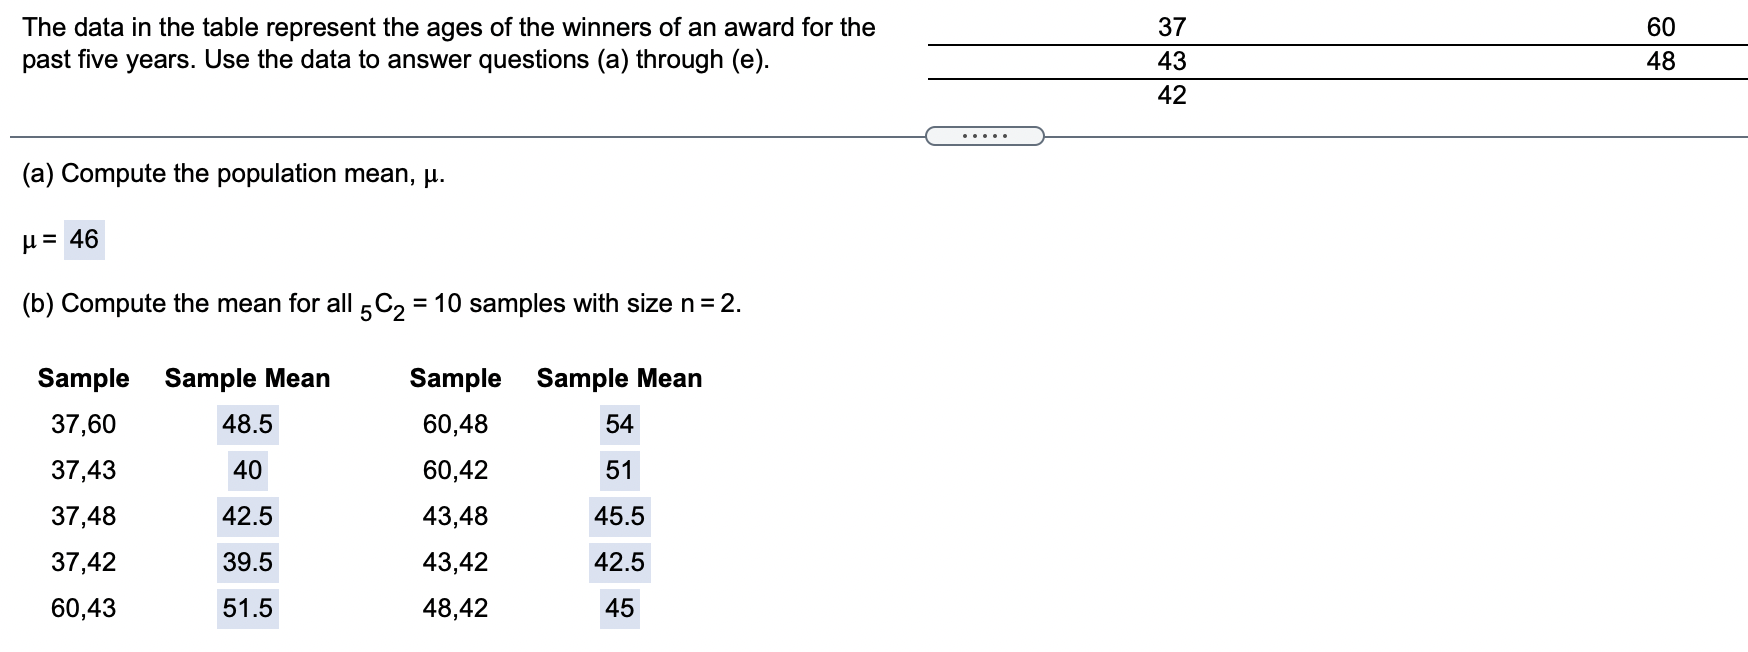
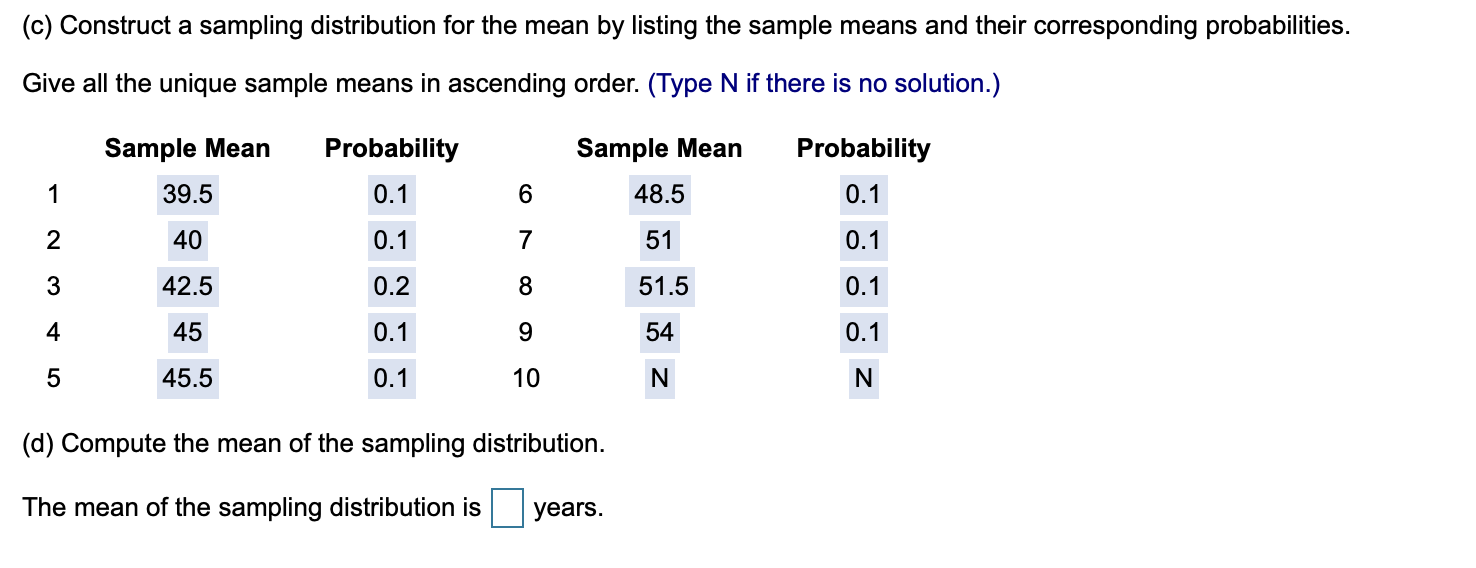
The data in the table represent the ages of the winners of an award for the 37 60 past five years. Use the data to
Step by Step Solution
There are 3 Steps involved in it
Step: 1

Get Instant Access to Expert-Tailored Solutions
See step-by-step solutions with expert insights and AI powered tools for academic success
Step: 2

Step: 3
Ace Your Homework with AI
Get the answers you need in no time with our AI-driven, step-by-step assistance
Get Started
Linear Algebra With Applications
Authors: Gareth Williams, Williams
9th Edition
1284120104, 9781284120103