

Answered step by step
Verified Expert Solution
Question
1 Approved Answer
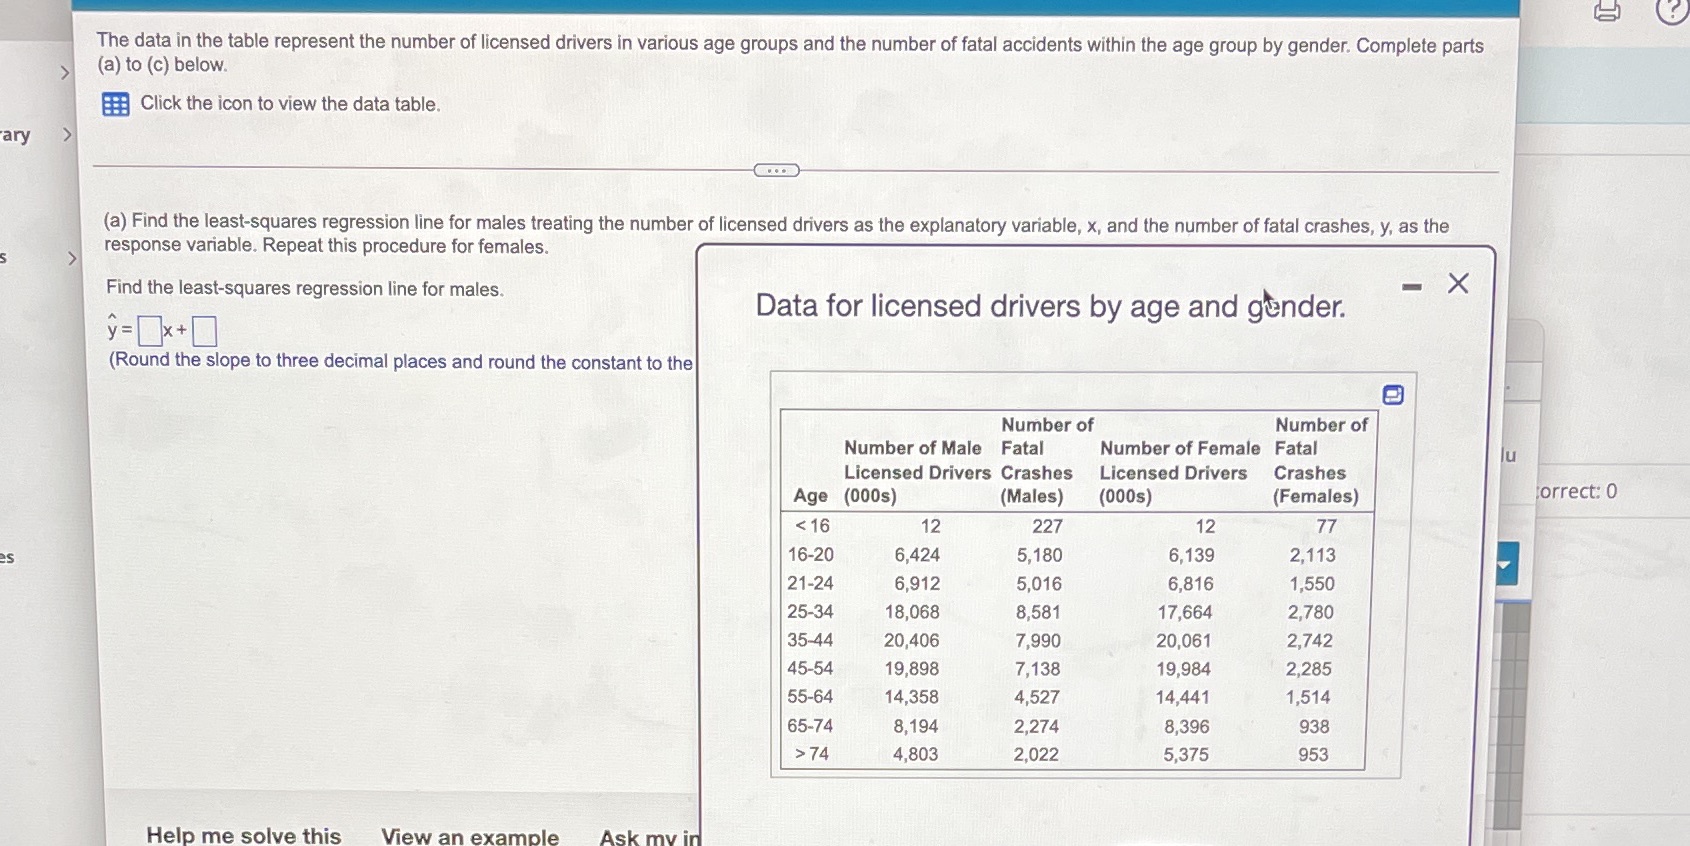
The data In the table represent the number of licensed drivers In various age groups and the number of fatal accidents within the age group

Step by Step Solution
There are 3 Steps involved in it
Step: 1

Get Instant Access to Expert-Tailored Solutions
See step-by-step solutions with expert insights and AI powered tools for academic success
Step: 2

Step: 3
Ace Your Homework with AI
Get the answers you need in no time with our AI-driven, step-by-step assistance
Get Started
Elementary Linear Programming With Applications
Authors: Bernard Kolman, Robert E Beck
2nd Edition
0080530796, 9780080530796