Answered step by step
Verified Expert Solution
Link Copied!

Question

1 Approved Answer

The data indicate _________ of variance; therefore, we should use the output under Equal Variances __________ A researcher compared the GPA of traditional (aged 18-22)

The data indicate _________ of variance; therefore, we should use the output under Equal Variances __________
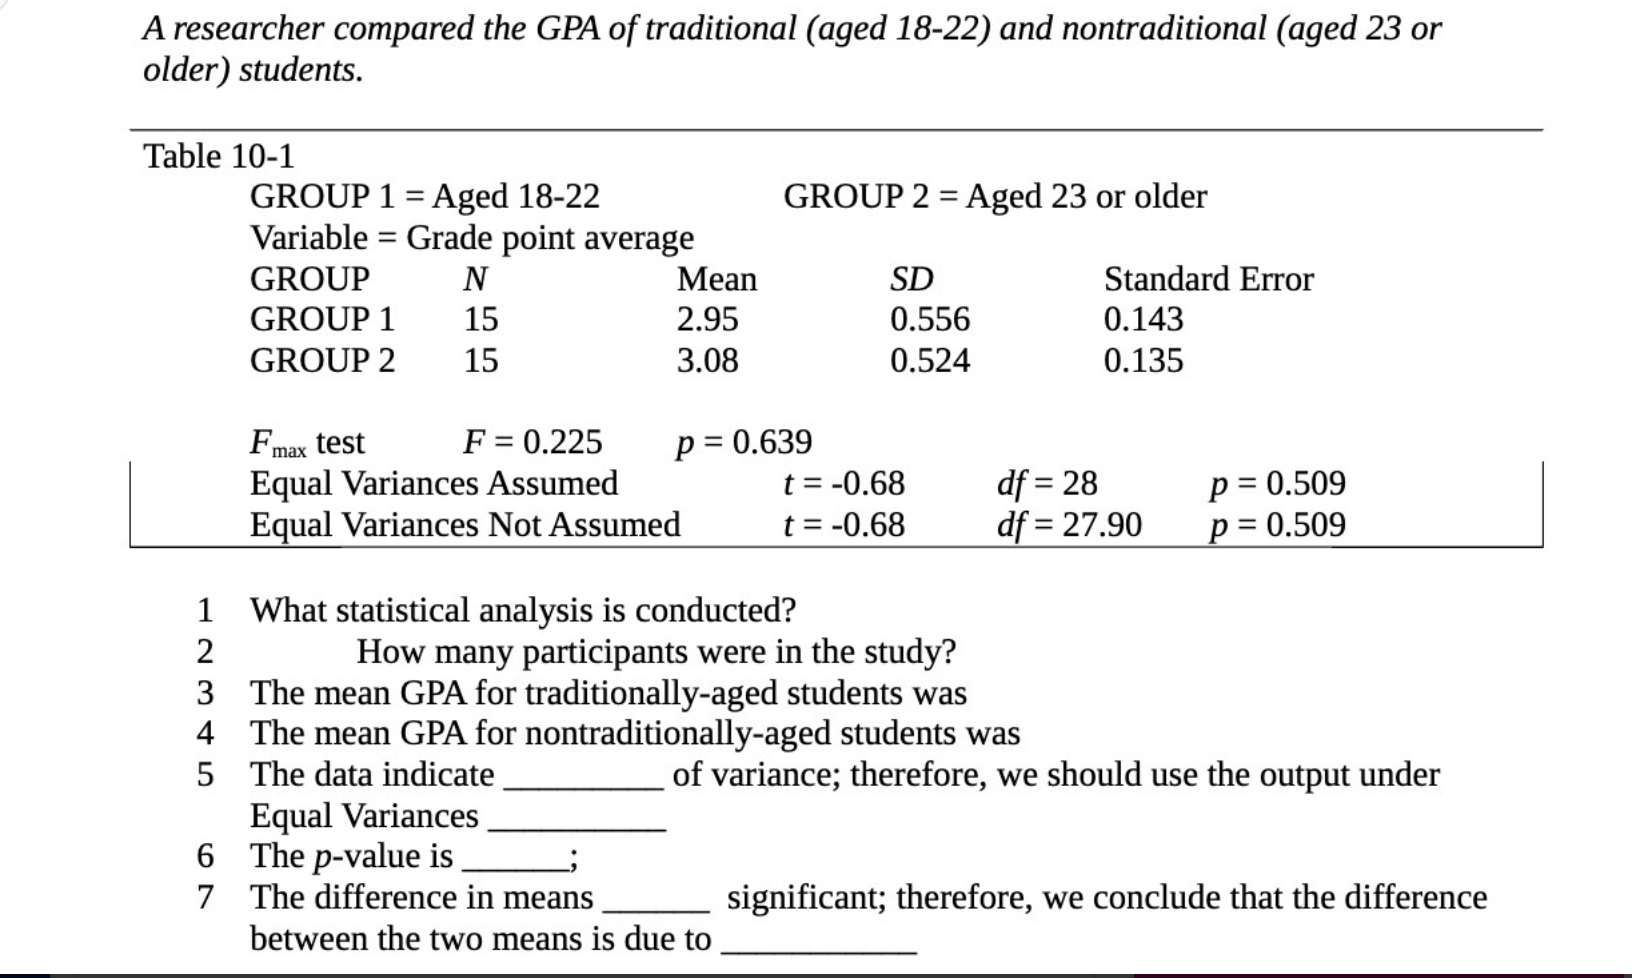
image text in transcribed
A researcher compared the GPA of traditional (aged 18-22) and nontraditional (aged 23 or older) students. Table 10-1 GROUP 1 = Aged 18-22 GROUP 2 = Aged 23 or older Variable = Grade point average GROUP N Mean SD Standard Error GROUP 1 15 2.95 0.556 0.143 GROUP 2 15 3.08 0.524 0.135 PM test F = 0.225 p = 0.639 Equal Variances Assumed = -0.68 df = 28 p = 0.509 Equal Variances Not Assumed = -0.68 df = 27.90 p = 0.509 What statistical analysis is conducted? How many participants were in the study? The mean GPA for traditionally-aged students was The mean GPA for nontraditionallyaged students was The data indicate of variance; therefore, we should use the output under Equal Variances The p-value is ' m-AWMrI um The difference in means signicant; therefore, we conclude that the difference between the two means is due to

Step by Step Solution

There are 3 Steps involved in it

Step: 1

blur-text-image

Get Instant Access to Expert-Tailored Solutions

See step-by-step solutions with expert insights and AI powered tools for academic success

Step: 2

blur-text-image

Step: 3

blur-text-image

Ace Your Homework with AI

Get the answers you need in no time with our AI-driven, step-by-step assistance

Get Started

Recommended Textbook for

Mcdougal Littell High School Math Algebra 1 2012

Authors: Ron Larson, Laurie Boswell, Timothy D. Kanold, Lee Stiff

1st Edition

9780547476841, 0547476841

More Books

Students also viewed these Mathematics questions