Question
The data is from the U.S. Department of Commerce sources to the Beer Institute, www.beerinstitue.org. The import data includes annual and monthly data.The data is
The data is from the U.S. Department of Commerce sources to the Beer Institute, "www.beerinstitue.org".
The import data includes annual and monthly data.The data is in units of barrels, a barrel is 31 gallons. Monthly data is from 1999 to December 2019. The annual data is from 1987 for bottles, cans, and draft, 1980 for total and extends to 2019.
The analysis includes regression models of imports on bottles, cans, drafts, and total. A forecast for each is provided for 2020 and for July, 2020.
This memo analyzes data on beer imports to the U.S. The data is from the U.S. Department of Commerce sources to the Beer Institute, "www.beerinstitue.org".
The import data includes annual and monthly data.The data is in units of barrels, a barrel is 31 gallons. Monthly data is from 1999 to December 2019. The annual data is from 1987 for bottles, cans, and draft, 1980 for total and extends to 2019.
The analysis includes regression models of imports on bottles, cans, drafts, and total. A forecast for each is provided for 2020 and for July, 2020.
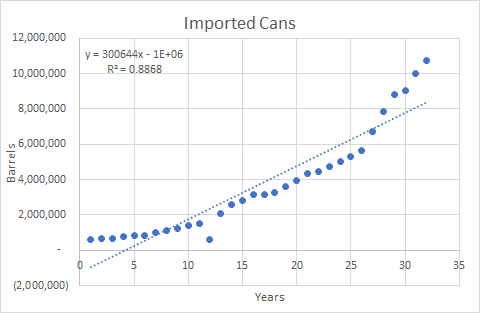
- Cans
- Cans=300644*years-1,000,006
- r^2=88%
- Standard Error:?
- Are all coefficients significant?
- Outliers?

Step by Step Solution
There are 3 Steps involved in it
Step: 1

Get Instant Access to Expert-Tailored Solutions
See step-by-step solutions with expert insights and AI powered tools for academic success
Step: 2

Step: 3

Ace Your Homework with AI
Get the answers you need in no time with our AI-driven, step-by-step assistance
Get Started


