The data is here
https://drive.google.com/file/d/1sz32tfzRPM1DgkDpm57ZL2pwVHYrG0oN/view?usp=sharing
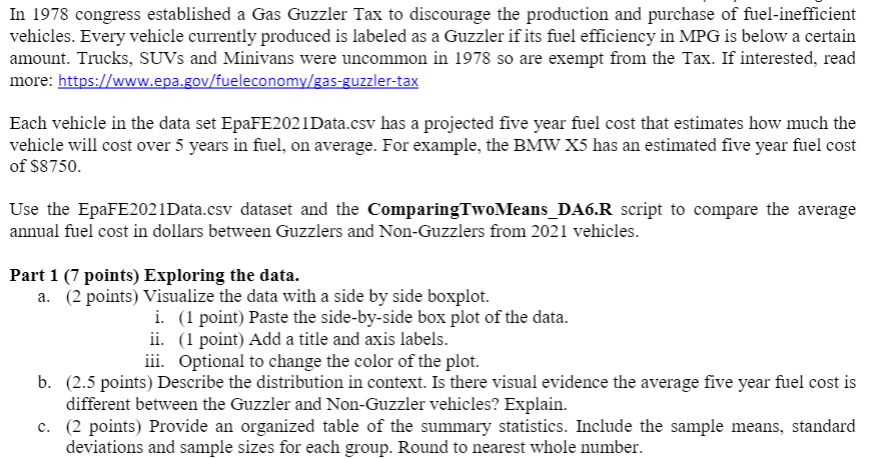
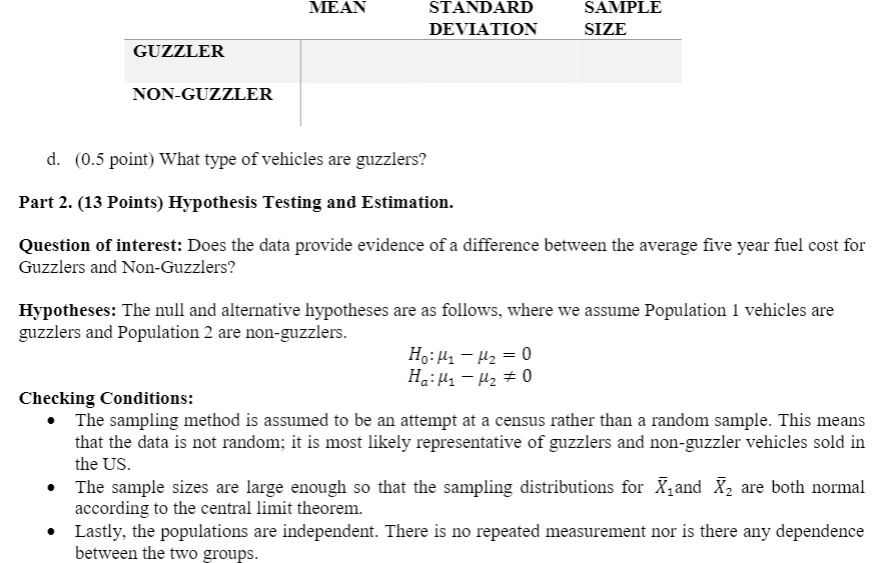
In 1978 congress established a Gas Guzzler Tax to discourage the production and purchase of fuel-inefcient vehicles. Every vehicle currently produced is labeled as a Guzzler if its fuel efficiency in MPG is below a certain amount. Trucks, SUVs and Minivans were uncommon in 1978 so are exempt from the Tax. If interested, read more: htt s: www.e a. ov fueleconom as uzzlertax Each vehicle in the data set EpaFEZOllDatacsv has a projected ve year fuel cost that estimates how much the vehicle will cost over 5 years in fuel, on average. For example, the BMW X5 has an estimated ve year fuel cost of $3750. Use the EpaFEEOZlData.csv dataset and the ComparingTwoMeans_DA6.R script to compare the average annual fuel cost in dollars between Guzzlers and Non-Guzzlers from 202 1 vehicles. Part 1 (7 points) Exploring the data. a. (2 points) Visualize the data with a side by side boxplot. i. (1 point) Paste the side-by-side box plot of the data. ii. (1 point) Add a title and axis labels. iii. Optional to change the color of the plot. b. (2.5 points) Describe the distribution in context. Is there visual evidence the average ve year fuel cost is different between the Guzzler and Non-Guzzler vehicles? Explain. c. (2 points) Provide an organized table of the summary statistics. Include the sample means, standard deviations and sample sizes for each group. Round to nearest whole number. NIEAN STANDARD SAI'MIPLE DEVIATION SIZE GUZZLER NONGUZHER d. (0.5 point} What type of vehicles are guzziers? Part 2. (13 Points) Hypothesis Testing and Estimation. Question of interest: Does the data provide evidence of a di'erence between the average ve year fuel cost for Guzzlers and Non-Guzzlers? Hypotheses: The null and alternative hypotheses are as follows, where we assume Population 1 vehicles are guzzlers and Population 2 are non-guzzlers. Hg: p1 M = 0 Ha: p1 #2 at 0 Checking Conditions: 0 The sampling method is assumed to be an attempt at a census rather than a random sample. This means that the data is not random; it is most likely representative of guzzlers and non-guzzler vehicles sold in the US. 0 The sample sizes are large enough so that the sampling distributions for gland X2 are both normal according to the central Limit theorem. 0 Lastly, the populations are independent. There is no repeated measurement nor is there any dependence between the two groups. Overall, the conditions are somewhat met. The sampling method is unknown so we should consider this in our conclusions. Calculate: a. (2 points) From the summary statistics calculate the test statistic \"by han \". Show work b. {1 point} State the degrees of freedom. You choose conservative or Satterthwaite. Either are okay. c. {1 point) Obtain a p-value based on your calculated test statistic and degrees of freedom from a t table. Show work. d. (2 points) From the summary statistics, calculate the 95% Condence Interval \"by hand\". Show work. e. (2 points) Obtain a p-value from t test and condence interval usingR. Paste the output. Are your answers dierent? Why, yesfno? Conclude: f From the R output, write a four-part conclusion describing the results. I (1 points) Provide a statement in terms of the alternative hypothesis. II (1 points) State Whether (or not) to reject the null. I (3 points) Give in context an interpretation of the point and interval estimate. 0 Make sure to provide a direction to your interval, for example, one group had a smaller (or larger) mean than the other, include this relationship in your point and interval estimate. 0 Include any other information you might feel to relevant