

Question
The data is Summary created: 25-Nov-2009 12:21:12 STATION: 46050 1 - MONTHLY AND ANNUAL FREQUENCY AND CUMULATIVE PERCENT FREQUENCY (10THS) ELEMENT: AIR TEMPERATURE (DEGREES C)
The data is
Summary created: 25-Nov-2009 12:21:12
STATION: 46050
1 - MONTHLY AND ANNUAL FREQUENCY AND CUMULATIVE PERCENT FREQUENCY (10THS)
ELEMENT: AIR TEMPERATURE (DEGREES C) -- POR: (11/1991 - 12/2008) (119447 RECORDS, 93.0% HAVE ELEMENT)
JAN FEB MAR APR MAY JUN JUL AUG SEP OCT NOV DEC ANN
F CPF F CPF F CPF F CPF F CPF F CPF F CPF F CPF F CPF F CPF F CPF F CPF F CPF
22 - - - - - - - - 1 # - - - - - - - - - - - - - - 1 #
21 - - - - - - - - - - - - - - - - 3 # - - - - - - 3 999
20 - - - - - - - - - - - - 2 # 1 # 6 999 - - - - - - 9 999
19 - - - - - - 1 # 1 999 - - 31 999 44 999 25 999 1 # - - - - 103 999
18 - - - - - - 1 999 3 999 1 # 144 997 360 996 190 997 4 999 - - - - 703 999
17 - - 1 # - - 5 999 18 999 59 999 838 984 953 963 476 977 26 999 - - - - 2376 993
16 - - 3 999 - - 7 999 38 998 377 994 1580 909 1695 874 1051 929 149 997 1 # - - 4901 973
15 - - 6 999 3 # 14 999 151 995 1671 959 2275 767 2223 717 1453 824 532 982 10 999 1 # 8339 932
14 45 # 35 999 11 999 56 997 1011 982 3246 804 2521 563 2708 512 1817 677 1380 929 248 999 40 999 13118 862
13 320 995 146 994 67 998 321 991 2562 895 3060 502 2196 337 2053 261 2320 494 2868 793 1343 975 314 996 17570 753
12 725 959 273 975 346 991 616 958 2807 675 1427 218 1133 140 631 71 1456 260 2641 509 2443 844 816 962 15314 605
11 1504 879 1183 939 1537 954 2174 894 2679 434 721 85 372 39 116 12 880 113 1673 247 2958 606 2046 874 17843 477
10 1964 712 2058 783 2245 788 2898 668 1453 204 182 18 56 6 18 2 198 25 523 81 1558 318 2249 654 15402 328
9 1750 494 1835 512 2368 546 2042 367 767 79 14 1 6 1 1 * 46 5 181 29 895 166 1842 412 11747 199
8 1240 300 1025 270 1610 291 967 155 141 13 - - - - - - - - 67 11 410 79 930 214 6390 101
7 650 162 464 135 698 117 349 55 10 1 - - - - - - - - 30 5 216 39 518 114 2935 47
6 342 90 292 74 219 42 142 19 - - - - - - - - - - 19 2 104 18 276 59 1394 23
5 185 52 98 35 124 18 34 4 - - - - - - - - - - - - 36 8 83 29 560 11
4 166 32 50 22 33 5 4 * - - - - - - - - - - - - 25 5 46 20 324 6
3 80 13 54 16 10 1 - - - - - - - - - - - - - - 10 2 17 15 171 3
2 32 4 46 9 - - - - - - - - - - - - - - - - 13 1 32 13 123 2
1 7 1 19 3 - - - - - - - - - - - - - - - - 1 * 46 10 73 1
0 1 * - - - - - - - - - - - - - - - - - - - - 17 5 18 *
-1 - - - - - - - - - - - - - - - - - - - - - - 10 3 10 *
-2 - - - - - - - - - - - - - - - - - - - - - - 18 2 18 *
-3 - - - - - - - - - - - - - - - - - - - - - - 2 * 2 *
75PCTL 10.6 10.3 10.2 10.7 12.7 14.2 15.3 15.6 14.9 13.3 12.0 10.8 13.4
50PCTL 9.5 9.4 9.3 9.9 11.7 13.4 14.2 14.4 13.5 12.4 11.1 9.8 11.7
25PCTL 8.2 8.3 8.3 9.0 10.6 12.6 13.0 13.4 12.4 11.5 10.0 8.7 9.8
MEAN 9.2 9.2 9.2 9.8 11.7 13.4 14.2 14.5 13.6 12.4 10.9 9.6 11.6
S.D. 2.1 1.8 1.5 1.5 1.5 1.3 1.6 1.5 1.8 1.5 1.7 2.0 2.6
TOTAL 9011 7588 9271 9631 11642 10758 11154 10803 9921 10094 10271 9303 119447
MAX 14.3 16.6 14.7 18.7 21.6 17.9 19.7 19.6 20.7 18.7 16.4 14.6 21.6
DATE 2003011723 1992022602 2004032106 1995042320 2008051622 2004061800 1998071823 1998082100 1997092123 1998102200 2001111919 1997121402 2008051622
MIN 0.1 0.8 2.5 4.1 6.5 8.7 9.0 9.4 8.7 5.6 1.4 -2.7 -2.7
DATE 1996013015 1995021318 2008033011 2008042013 1999050820 1999060212 2008071511 1996081017 2000092511 2002103017 1993112415 1998122019 1998122019
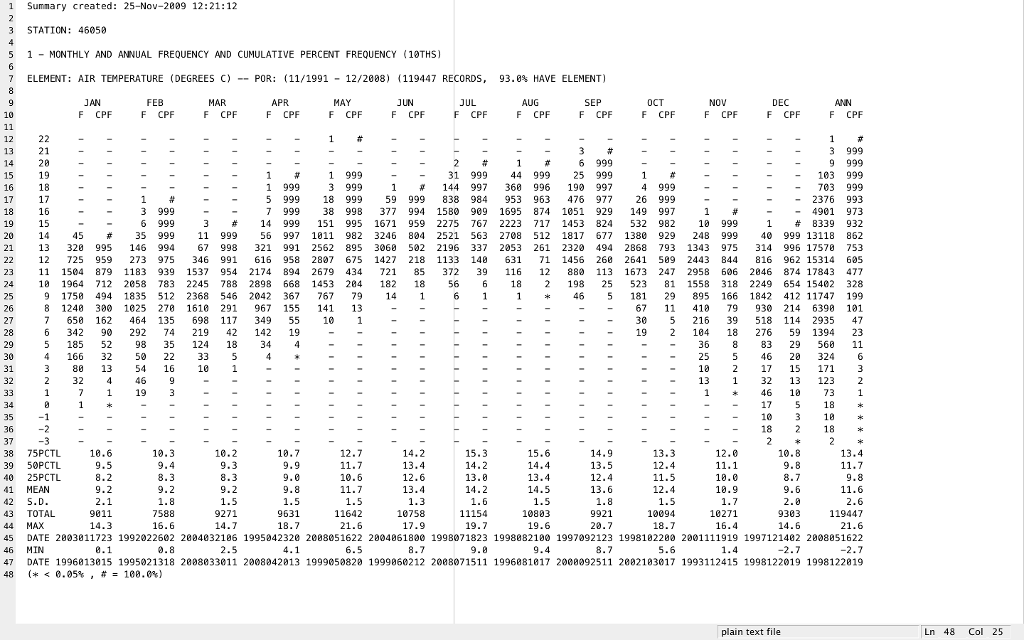
(* 3. A trickier task. Look at the file air temp distributions.txt. This also comes from Stonewall. It is the air temperature climatology for each month. It has complex file formatting, but you can find some details at http://www.ndbc.noaa.gov/climatedesc.shtml. In the first column you find degrees C. In following 'column pairs' (one for each month), you find the PDF and the CDF of temperatures. The CDF values are in tenths of percent. While not explicitly stated, it looks to me like the PDF values are in hundreths of percent. The CDF should be the integral of the PDF. Note that there are a lot of 'non- numeric' characters in this file which will greatly complicate the data input. I would like you to write an mfile that will read in this data. I would then like vou to make a plot that displays the CDF for Jan, July, and annual (can use 3 x 1 subplot if you like). Further down in the file, you will see that the 75th, 50h and 25th percentile values are given. Please superimpose these on your curves (use a symbol only (circle, etc.) for these data points). Label everything, make it look nice, and good TucK! 3. A trickier task. Look at the file air temp distributions.txt. This also comes from Stonewall. It is the air temperature climatology for each month. It has complex file formatting, but you can find some details at http://www.ndbc.noaa.gov/climatedesc.shtml. In the first column you find degrees C. In following 'column pairs' (one for each month), you find the PDF and the CDF of temperatures. The CDF values are in tenths of percent. While not explicitly stated, it looks to me like the PDF values are in hundreths of percent. The CDF should be the integral of the PDF. Note that there are a lot of 'non- numeric' characters in this file which will greatly complicate the data input. I would like you to write an mfile that will read in this data. I would then like vou to make a plot that displays the CDF for Jan, July, and annual (can use 3 x 1 subplot if you like). Further down in the file, you will see that the 75th, 50h and 25th percentile values are given. Please superimpose these on your curves (use a symbol only (circle, etc.) for these data points). Label everything, make it look nice, and good TucK
Step by Step Solution
There are 3 Steps involved in it
Step: 1

Get Instant Access to Expert-Tailored Solutions
See step-by-step solutions with expert insights and AI powered tools for academic success
Step: 2

Step: 3
Ace Your Homework with AI
Get the answers you need in no time with our AI-driven, step-by-step assistance
Get Started
Excel As Your Database
Authors: Paul Cornell
1st Edition
1590597516, 978-1590597514