the data is too big in excel, i didn't post all. please use excel to explaine how to solve those question. Thanks!

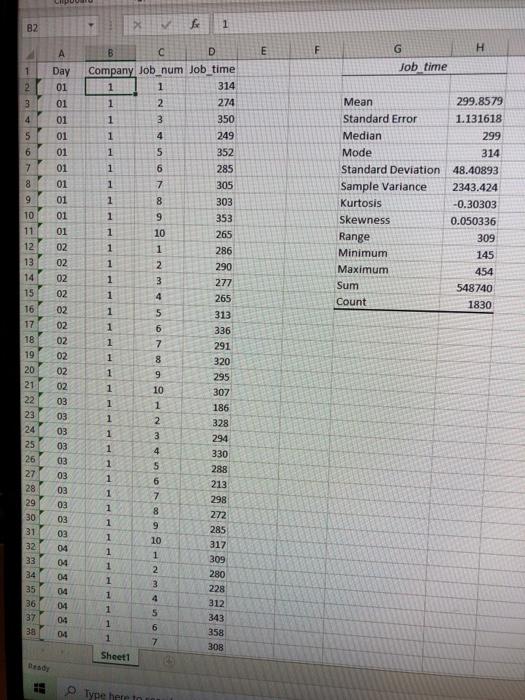
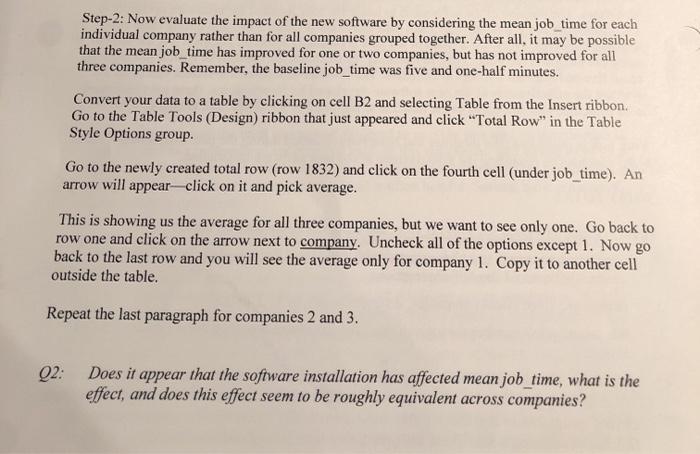
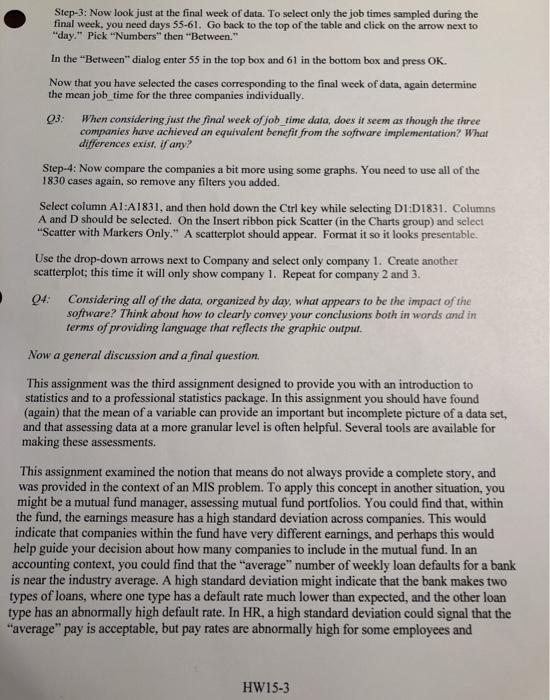
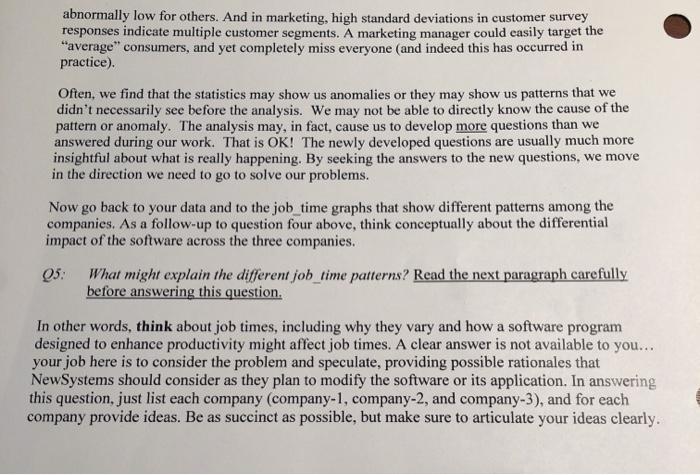
B2 1 E A F G H 1 Job time 2 3 4 5 Day 01 01 01 01 01 01 01 01 01 6 7 Mean 299.8579 Standard Error 1.131618 Median 299 Mode 314 Standard Deviation 48.40893 Sample Variance 2343.424 Kurtosis -0.30303 Skewness 0.050336 Range 309 Minimum 145 Maximum 454 Sum 548740 Count 1830 286 290 10 11 12 13 14 15 16 17 18 19 20 21 22 23 24 25 26 27 28 29 02 02 02 02 02 02 03 03 03 03 B D Company Job_num Job_time 1 1 314 1 2 274 1 3 350 1 4 249 1 5 352 1 6 285 1 7 305 1 8 303 1 9 353 1 10 265 1 1 1 2 1 3 277 1 4 265 1 5 313 1 6 336 1 7 291 1 8 320 1 9 295 1 10 307 1 1 186 1 2 328 1 3 294 1 4 330 1 5 288 1 6 213 1 7 298 1 8 272 1 9 285 1 10 1 1 309 1 2 280 1 3 228 1 4 312 1 5 343 1 6 1 7 308 03 03 03 03 30 03 317 NAM 38 1 1 358 Sheet1 Type here to Step-2: Now evaluate the impact of the new software by considering the mean job_time for each individual company rather than for all companies grouped together. After all, it may be possible that the mean job_time has improved for one or two companies, but has not improved for all three companies. Remember, the baseline job_time was five and one-half minutes. Convert your data to a table by clicking on cell B2 and selecting Table from the Insert ribbon Go to the Table Tools (Design) ribbon that just appeared and click "Total Row" in the Table Style Options group. Go to the newly created total row (row 1832) and click on the fourth cell (under job_time). An arrow will appear-click on it and pick average. This is showing us the average for all three companies, but we want to see only one. Go back to row one and click on the arrow next to company. Uncheck all of the options except 1. Now go back to the last row and you will see the average only for company 1. Copy it to another cell outside the table. Repeat the last paragraph for companies 2 and 3. Q2: Does it appear that the software installation has affected mean job_time, what is the effect, and does this effect seem to be roughly equivalent across companies? Step-3: Now look just at the final week of data. To select only the job times sampled during the final week. you need days 55-61. Go back to the top of the table and click on the arrow next to "day." Pick "Numbers" then "Between." In the "Between" dialog enter 55 in the top box and 61 in the bottom box and press OK. Now that you have selected the cases corresponding to the final week of data, again determine the mean job_time for the three companies individually. 03 When considering just the final week of job_time data, does it seem as though the three companies have achieved an equivalent benefit from the software implementation? What differences exist. if any? Step-4: Now compare the companies a bit more using some graphs. You need to use all of the 1830 cases again, so remove any filters you added. Select column A1:A1831, and then hold down the Ctrl key while selecting DI:D1831. Columns A and D should be selected. On the Insert ribbon pick Scatter in the Charts group) and select Scatter with Markers Only." A scatterplot should appear. Format it so it looks presentable. Use the drop-down arrows next to Company and select only company 1. Create another scatterplot; this time it will only show company 1. Repeat for company 2 and 3. Q4: Considering all of the data, organized by day, what appears to be the impact of the software? Think about how to clearly convey your conclusions both in words and in terms of providing language that reflects the graphic output. Now a general discussion and a final question This assignment was the third assignment designed to provide you with an introduction to statistics and to a professional statistics package. In this assignment you should have found (again) that the mean of a variable can provide an important but incomplete picture of a data set, and that assessing data at a more granular level is often helpful. Several tools are available for making these assessments. This assignment examined the notion that means do not always provide a complete story, and was provided in the context of an MIS problem. To apply this concept in another situation, you might be a mutual fund manager, assessing mutual fund portfolios. You could find that, within the fund, the earnings measure has a high standard deviation across companies. This would indicate that companies within the fund have very different earnings, and perhaps this would help guide your decision about how many companies to include in the mutual fund. In an accounting context, you could find that the "average" number of weekly loan defaults for a bank is near the industry average. A high standard deviation might indicate that the bank makes two types of loans, where one type has a default rate much lower than expected, and the other loan type has an abnormally high default rate. In HR, a high standard deviation could signal that the "average" pay is acceptable, but pay rates are abnormally high for some employees and HW15-3 abnormally low for others. And in marketing, high standard deviations in customer survey responses indicate multiple customer segments. A marketing manager could easily target the "average consumers, and yet completely miss everyone and indeed this has occurred in practice) Often, we find that the statistics may show us anomalies or they may show us patterns that we didn't necessarily see before the analysis. We may not be able to directly know the cause of the pattern or anomaly. The analysis may, in fact, cause us to develop more questions than we answered during our work. That is OK! The newly developed questions are usually much more insightful about what is really happening. By seeking the answers to the new questions, we move in the direction we need to go to solve our problems. Now go back to your data and to the job_time graphs that show different patterns among the companies. As a follow-up to question four above, think conceptually about the differential impact of the software across the three companies. 05. What might explain the different job_time patterns? Read the next paragraph carefully before answering this question. In other words, think about job times, including why they vary and how a software program designed to enhance productivity might affect job times. A clear answer is not available to you... your job here is to consider the problem and speculate, providing possible rationales that NewSystems should consider as they plan to modify the software or its application. In answering this question, just list each company (company-1, company-2, and company-3), and for each company provide ideas. Be as succinct as possible, but make sure to articulate your ideas clearly. B2 1 E A F G H 1 Job time 2 3 4 5 Day 01 01 01 01 01 01 01 01 01 6 7 Mean 299.8579 Standard Error 1.131618 Median 299 Mode 314 Standard Deviation 48.40893 Sample Variance 2343.424 Kurtosis -0.30303 Skewness 0.050336 Range 309 Minimum 145 Maximum 454 Sum 548740 Count 1830 286 290 10 11 12 13 14 15 16 17 18 19 20 21 22 23 24 25 26 27 28 29 02 02 02 02 02 02 03 03 03 03 B D Company Job_num Job_time 1 1 314 1 2 274 1 3 350 1 4 249 1 5 352 1 6 285 1 7 305 1 8 303 1 9 353 1 10 265 1 1 1 2 1 3 277 1 4 265 1 5 313 1 6 336 1 7 291 1 8 320 1 9 295 1 10 307 1 1 186 1 2 328 1 3 294 1 4 330 1 5 288 1 6 213 1 7 298 1 8 272 1 9 285 1 10 1 1 309 1 2 280 1 3 228 1 4 312 1 5 343 1 6 1 7 308 03 03 03 03 30 03 317 NAM 38 1 1 358 Sheet1 Type here to Step-2: Now evaluate the impact of the new software by considering the mean job_time for each individual company rather than for all companies grouped together. After all, it may be possible that the mean job_time has improved for one or two companies, but has not improved for all three companies. Remember, the baseline job_time was five and one-half minutes. Convert your data to a table by clicking on cell B2 and selecting Table from the Insert ribbon Go to the Table Tools (Design) ribbon that just appeared and click "Total Row" in the Table Style Options group. Go to the newly created total row (row 1832) and click on the fourth cell (under job_time). An arrow will appear-click on it and pick average. This is showing us the average for all three companies, but we want to see only one. Go back to row one and click on the arrow next to company. Uncheck all of the options except 1. Now go back to the last row and you will see the average only for company 1. Copy it to another cell outside the table. Repeat the last paragraph for companies 2 and 3. Q2: Does it appear that the software installation has affected mean job_time, what is the effect, and does this effect seem to be roughly equivalent across companies? Step-3: Now look just at the final week of data. To select only the job times sampled during the final week. you need days 55-61. Go back to the top of the table and click on the arrow next to "day." Pick "Numbers" then "Between." In the "Between" dialog enter 55 in the top box and 61 in the bottom box and press OK. Now that you have selected the cases corresponding to the final week of data, again determine the mean job_time for the three companies individually. 03 When considering just the final week of job_time data, does it seem as though the three companies have achieved an equivalent benefit from the software implementation? What differences exist. if any? Step-4: Now compare the companies a bit more using some graphs. You need to use all of the 1830 cases again, so remove any filters you added. Select column A1:A1831, and then hold down the Ctrl key while selecting DI:D1831. Columns A and D should be selected. On the Insert ribbon pick Scatter in the Charts group) and select Scatter with Markers Only." A scatterplot should appear. Format it so it looks presentable. Use the drop-down arrows next to Company and select only company 1. Create another scatterplot; this time it will only show company 1. Repeat for company 2 and 3. Q4: Considering all of the data, organized by day, what appears to be the impact of the software? Think about how to clearly convey your conclusions both in words and in terms of providing language that reflects the graphic output. Now a general discussion and a final question This assignment was the third assignment designed to provide you with an introduction to statistics and to a professional statistics package. In this assignment you should have found (again) that the mean of a variable can provide an important but incomplete picture of a data set, and that assessing data at a more granular level is often helpful. Several tools are available for making these assessments. This assignment examined the notion that means do not always provide a complete story, and was provided in the context of an MIS problem. To apply this concept in another situation, you might be a mutual fund manager, assessing mutual fund portfolios. You could find that, within the fund, the earnings measure has a high standard deviation across companies. This would indicate that companies within the fund have very different earnings, and perhaps this would help guide your decision about how many companies to include in the mutual fund. In an accounting context, you could find that the "average" number of weekly loan defaults for a bank is near the industry average. A high standard deviation might indicate that the bank makes two types of loans, where one type has a default rate much lower than expected, and the other loan type has an abnormally high default rate. In HR, a high standard deviation could signal that the "average" pay is acceptable, but pay rates are abnormally high for some employees and HW15-3 abnormally low for others. And in marketing, high standard deviations in customer survey responses indicate multiple customer segments. A marketing manager could easily target the "average consumers, and yet completely miss everyone and indeed this has occurred in practice) Often, we find that the statistics may show us anomalies or they may show us patterns that we didn't necessarily see before the analysis. We may not be able to directly know the cause of the pattern or anomaly. The analysis may, in fact, cause us to develop more questions than we answered during our work. That is OK! The newly developed questions are usually much more insightful about what is really happening. By seeking the answers to the new questions, we move in the direction we need to go to solve our problems. Now go back to your data and to the job_time graphs that show different patterns among the companies. As a follow-up to question four above, think conceptually about the differential impact of the software across the three companies. 05. What might explain the different job_time patterns? Read the next paragraph carefully before answering this question. In other words, think about job times, including why they vary and how a software program designed to enhance productivity might affect job times. A clear answer is not available to you... your job here is to consider the problem and speculate, providing possible rationales that NewSystems should consider as they plan to modify the software or its application. In answering this question, just list each company (company-1, company-2, and company-3), and for each company provide ideas. Be as succinct as possible, but make sure to articulate your ideas clearly


