

Answered step by step
Verified Expert Solution
Question
1 Approved Answer
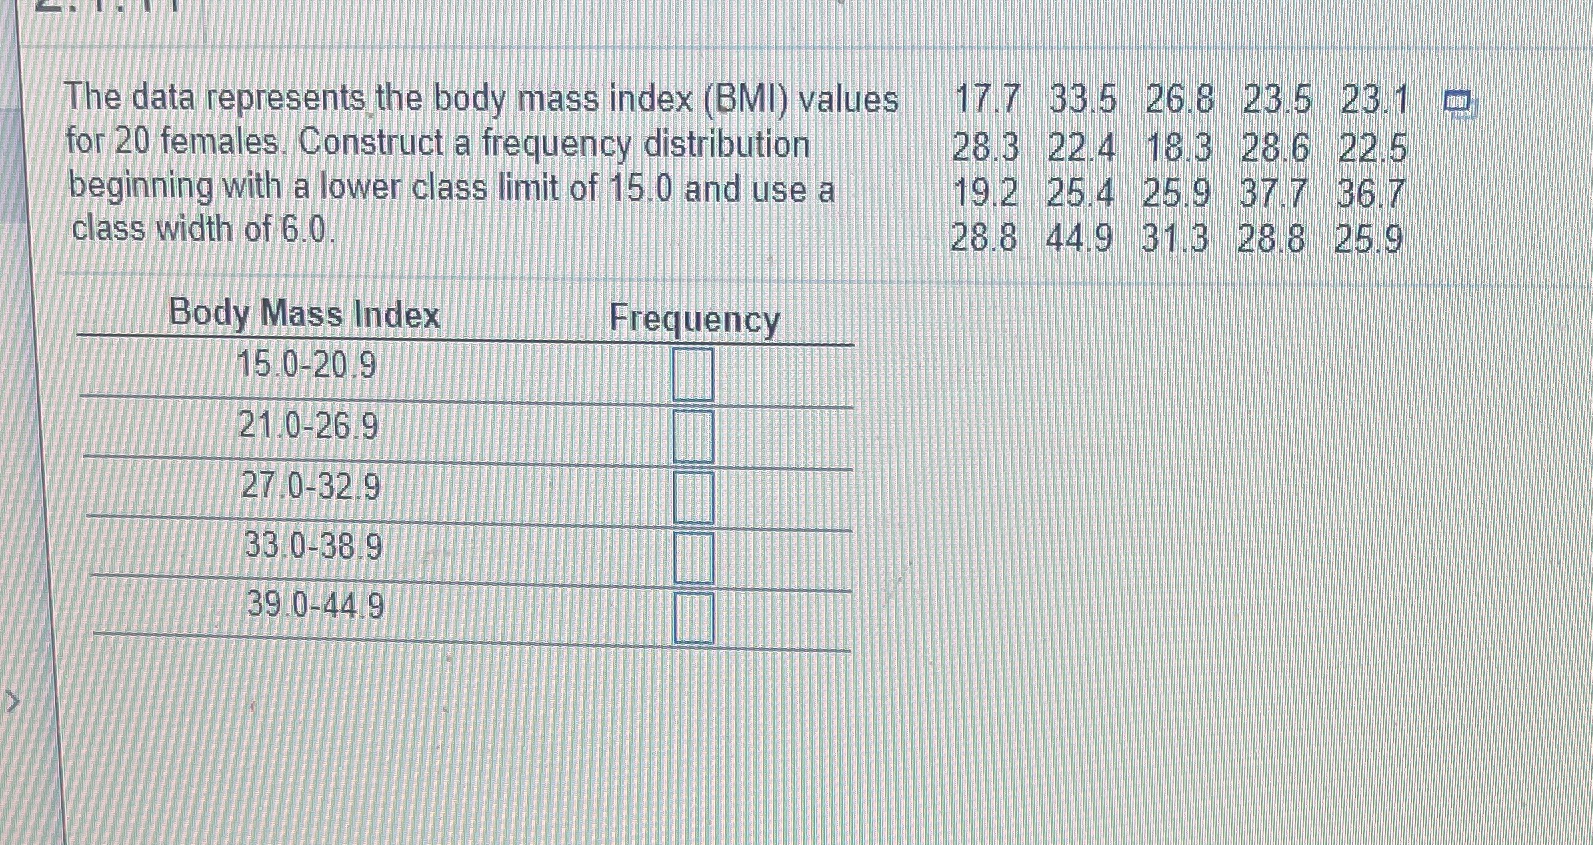
The data represents the body mass index (BMI) values 17 7 335 268 235 231 0 for 20 females. Construct a frequency distribution 28.3 224

Step by Step Solution
There are 3 Steps involved in it
Step: 1

Get Instant Access to Expert-Tailored Solutions
See step-by-step solutions with expert insights and AI powered tools for academic success
Step: 2

Step: 3
Ace Your Homework with AI
Get the answers you need in no time with our AI-driven, step-by-step assistance
Get Started
Partial Differential Equations For Scientists And Engineers
Authors: Stanley J Farlow
1st Edition
0486134733, 9780486134734