

Answered step by step
Verified Expert Solution
Question
1 Approved Answer
The data set faithful in R package faraway contains the variables eruptions which is the average number of eruptions by the Old Faithful Geyser at
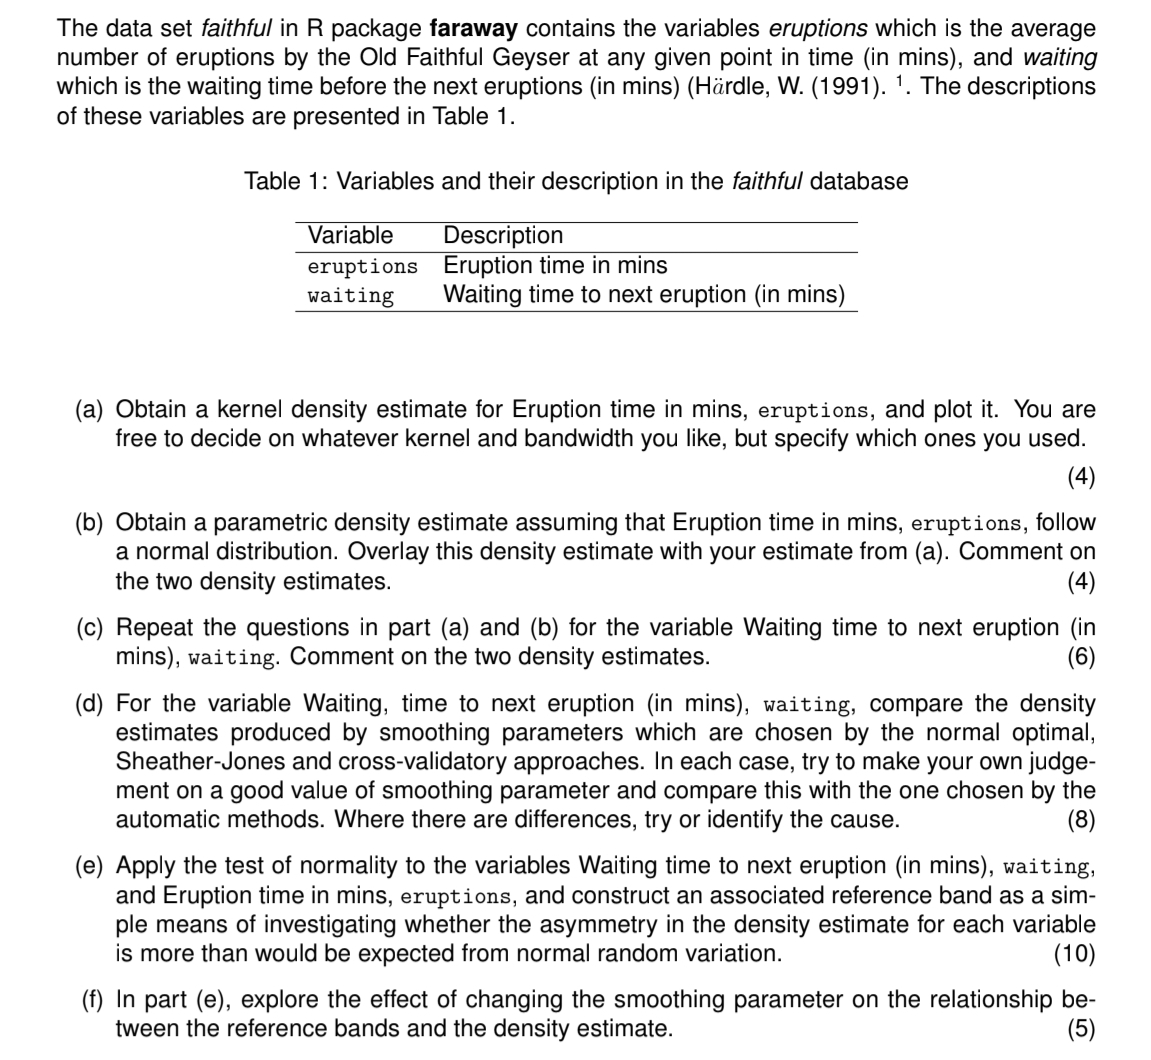
The data set faithful in package faraway contains the variables eruptions which is the average number of eruptions by the Old Faithful Geyser at any given point in time in mins and waiting which is the waiting time before the next eruptions in minsHrdle W The descriptions of these variables are presented in Table
Table : Variables and their description in the faithful database
tableVariableDescriptioneruptionsEruption time in minswaitingWaiting time to next eruption in mins
a Obtain a kernel density estimate for Eruption time in mins, eruptions, and plot it You are free to decide on whatever kernel and bandwidth you like, but specify which ones you used.
b Obtain a parametric density estimate assuming that Eruption time in mins, eruptions, follow a normal distribution. Overlay this density estimate with your estimate from a Comment on the two density estimates.
c Repeat the questions in part a and b for the variable Waiting time to next eruption in mins waiting. Comment on the two density estimates.
d For the variable Waiting, time to next eruption in mins waiting, compare the density estimates produced by smoothing parameters which are chosen by the normal optimal, SheatherJones and crossvalidatory approaches. In each case, try to make your own judgement on a good value of smoothing parameter and compare this with the one chosen by the automatic methods. Where there are differences, try or identify the cause.
e Apply the test of normality to the variables Waiting time to next eruption in mins waiting, and Eruption time in mins, eruptions, and construct an associated reference band as a simple means of investigating whether the asymmetry in the density estimate for each variable is more than would be expected from normal random variation.
f In part e explore the effect of changing the smoothing parameter on the relationship between the reference bands and the density estimate.
Step by Step Solution
There are 3 Steps involved in it
Step: 1

Get Instant Access to Expert-Tailored Solutions
See step-by-step solutions with expert insights and AI powered tools for academic success
Step: 2

Step: 3
Ace Your Homework with AI
Get the answers you need in no time with our AI-driven, step-by-step assistance
Get Started
Database And Expert Systems Applications 24th International Conference Dexa 2013 Prague Czech Republic August 2013 Proceedings Part 1 Lncs 8055
Authors: Hendrik Decker ,Lenka Lhotska ,Sebastian Link ,Josef Basl ,A Min Tjoa
2013 Edition