Answered step by step
Verified Expert Solution
Question
1 Approved Answer
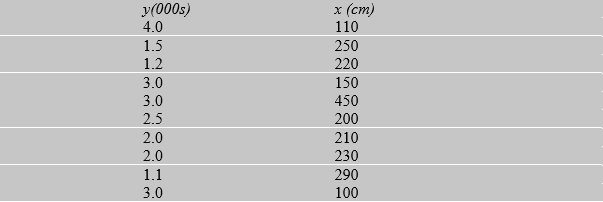
The data set provided by NADMO shows the number of yearly values of flood damage relief items represented by y and the annual rainfall (in
The data set provided by NADMO shows the number of yearly values of flood damage relief items represented by y and the annual rainfall (in centimeters) represented by x over a period of 10 years.
(a) Find the standard deviations of x and y.
(b)Find the equation of the least-squares regression line, assuming that the value of the relief
items for flood damage depending on the amount of rainfall.
(c) Calculate the correlation coefficient using the NADMO data and comment on the result
 \f
\f Step by Step Solution
There are 3 Steps involved in it
Step: 1

Get Instant Access to Expert-Tailored Solutions
See step-by-step solutions with expert insights and AI powered tools for academic success
Step: 2

Step: 3

Ace Your Homework with AI
Get the answers you need in no time with our AI-driven, step-by-step assistance
Get Started


