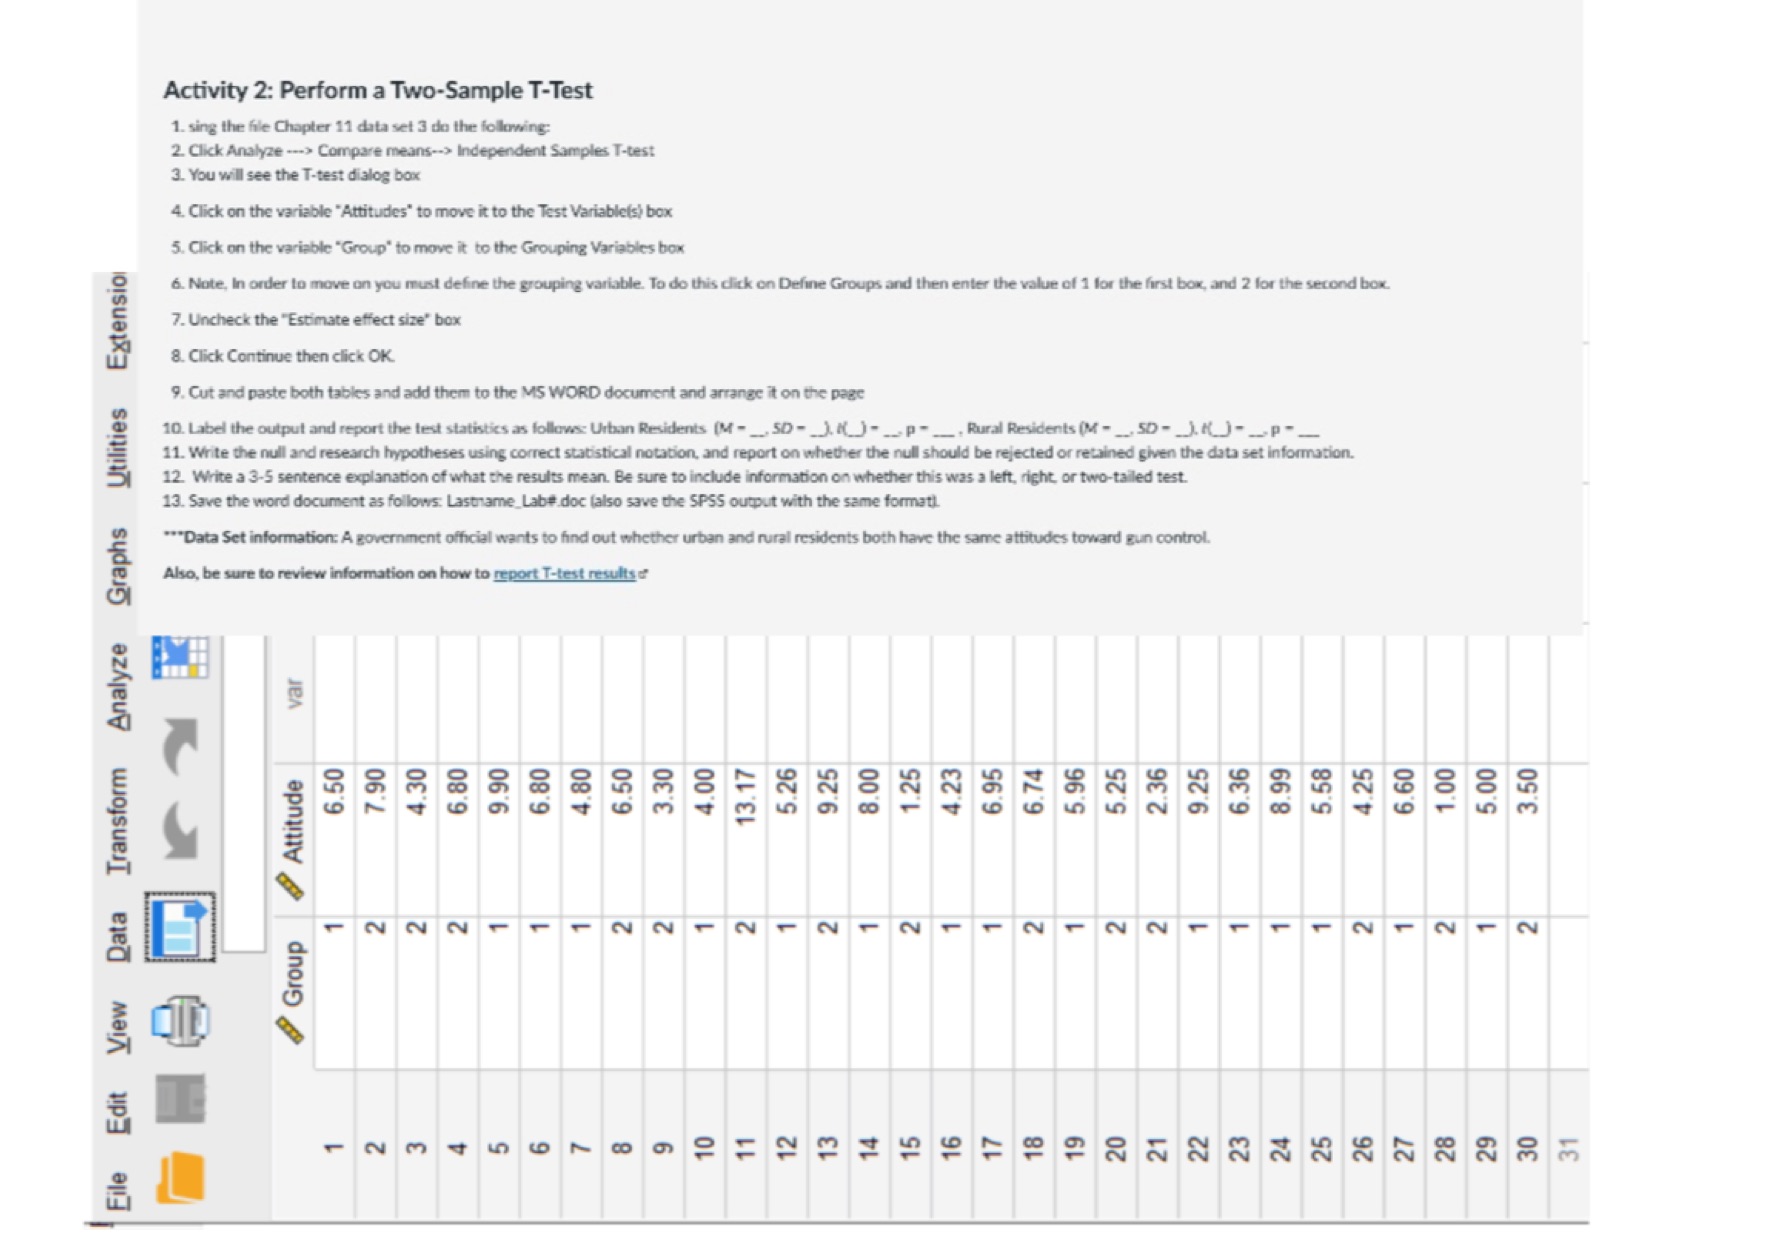
The data values are at the bottom, sideways
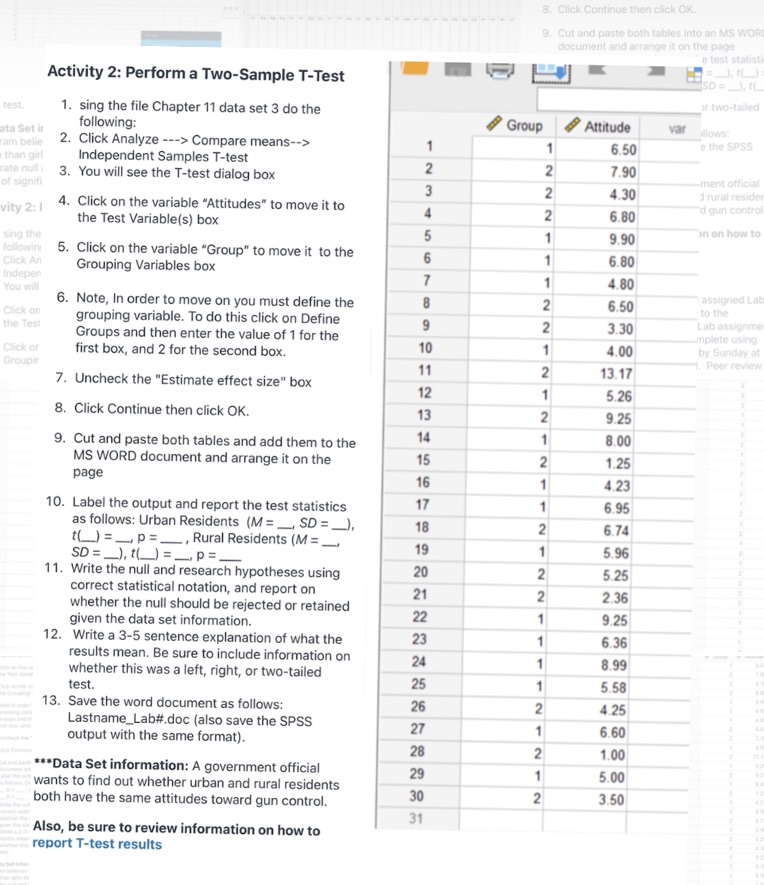
File Edit View Data Transform Analyze Graphs Utilities Extension 13. Save the word docum .*"Data Set information: A go 8. Click Continue then click OK. Group Attitude var 3. You will see the T-test dialog box 7. Uncheck the "Estimate effect size" box 6.50 1. sing the file Chapter 11 data set 3 do the following: 7.90 Activity 2: Perform a Two-Sample T-Test Also, be sure to review information on how to report T-test results F NNN 2. Click Analyze ---> Compare means--> Independent Samples T-test 4.30 4. Click on the variable "Attitudes" to move it to the Test Variablets) box 5. Click on the variable "Group" to move it to the Grouping Variables box 6.80 9.90 9. Cut and paste both tables and add them to the MS WORD document and arrange it on the page 6.80 4.8 5.50 ent as follows: Lastname_Labe.doc (also save the SPSS output with the same format). 3.30 12. Write a 3-5 sentence explanation of what the results mean. Be sure to include information on whether this was a left, right. or two-tailed test. 10. Label the output and report the test statistics as follows: Urban Residents (M -_. SD - _J.()- __. p- __. Rural Residents (M - _.50 - _).() - _p- _ 11. Write the null and research hypotheses using correct statistical notation, and report on whether the null should be rejected or retained given the data set information. 6. Note, In order to move on you must define the grouping variable. To do this click on Define Groups and then enter the value of 1 for the first box, and 2 for the second box. 5.26 at official wants to find out whether urban and rural residents both have the same attitudes toward gun control. IN IN 4.23 6.74 5.96 5.25 NN 2.36 9.25 6.36 8.99 5.58 IN 6.60 1.00 5.00 - N 3.508. Click Continue then click OK. 9. Cut and paste both tables into an MS WOR document and arrange it on the page "e test statis Activity 2: Perform a Two-Sample T-Test or two-tailed test. 1. sing the file Chapter 11 data set 3 do the following: Group Attitude var ta Set it illows: am belie 2. Click Analyze ---> Compare means--> 6.50 e the SPSS than girl Independent Samples T-test ate null 7.90 3. You will see the T-test dialog box W N ment official of signifi 4.30 i rural reside d gun contro vity 2:1 4. Click on the variable "Attitudes" to move it to -NNN 6.80 the Test Variable(s) box sing the 9.90 on on how to following 5. Click on the variable "Group" to move it to the 6.80 Click An Grouping Variables box Indepen 4.80 You will assigned La 6. Note, In order to move on you must define the 6.50 to the Click on the Test grouping variable. To do this click on Define 3.30 Lab assignm Groups and then enter the value of 1 for the mplete using -NANN Click or first box, and 2 for the second box. 10 4.00 by Sunday at Peer review Groupir 11 13.17 7. Uncheck the "Estimate effect size" box 12 5.26 8. Click Continue then click OK. 13 9.25 - N 14 9. Cut and paste both tables and add them to the 8.00 MS WORD document and arrange it on the 15 1.25 page 16 4.23 10. Label the output and report the test statistics 17 6.95 as follows: Urban Residents (M = _, SD = _), 18 6.74 , Rural Residents (M = _ 19 - N N- N- - N 5.96 SD = _), () = _ P=_ 11. Write the null and research hypotheses using 20 5.25 correct statistical notation, and report on 21 2.36 whether the null should be rejected or retained given the data set information. 22 9.25 12. Write a 3-5 sentence explanation of what the 23 6.36 results mean. Be sure to include information on 24 8.99 whether this was a left, right, or two-tailed test 25 5.58 13. Save the word document as follows: 26 4.25 Lastname_Lab#.doc (also save the SPSS 27 6.60 output with the same format). 28 1.00 *Data Set information: A government official 29 5.00 wants to find out whether urban and rural residents 30 both have the same attitudes toward gun control. 3.50 31 Also, be sure to review information on how to report T-test results