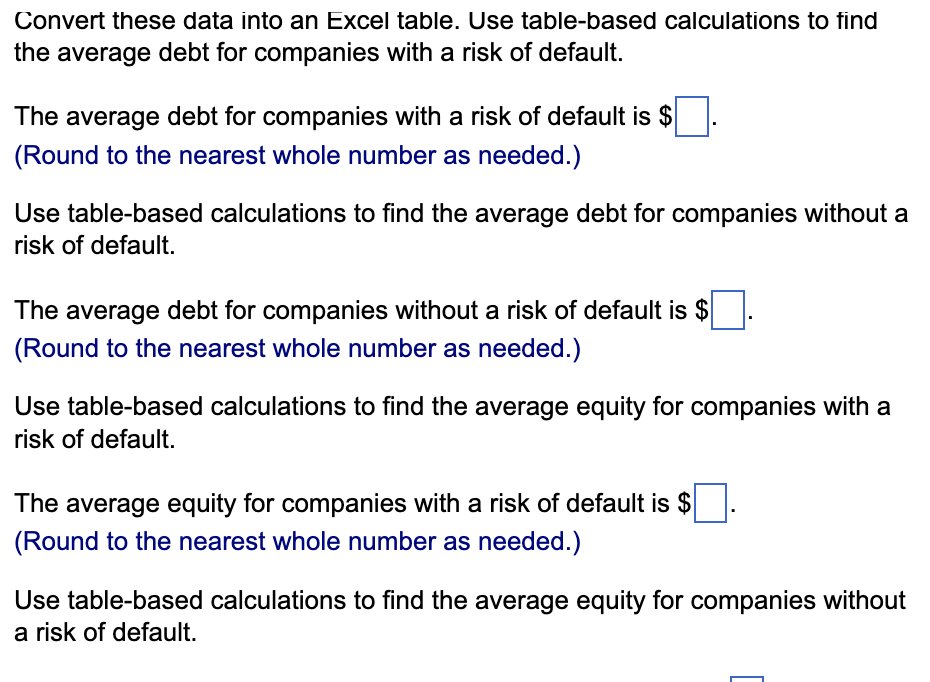
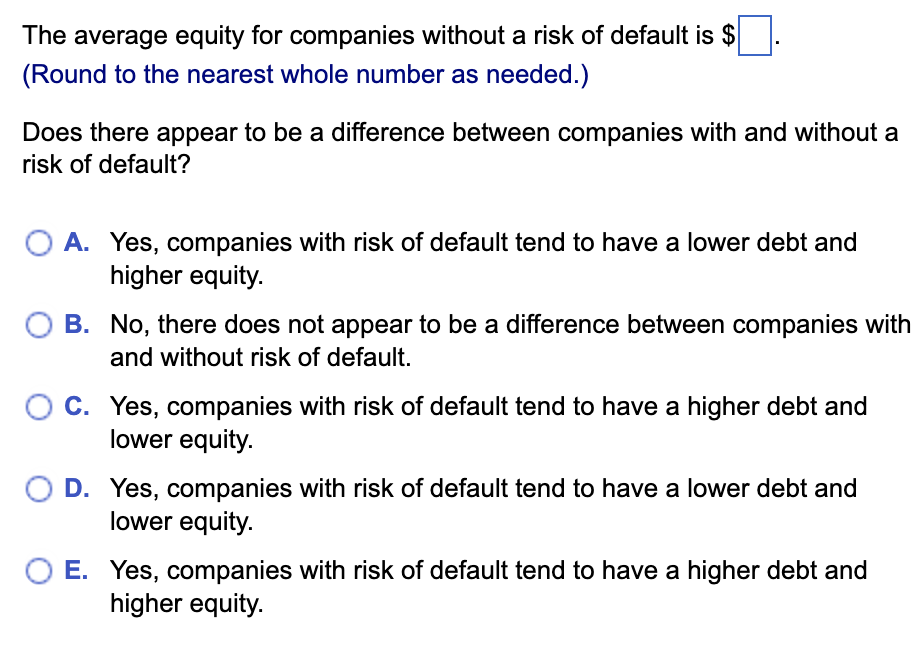
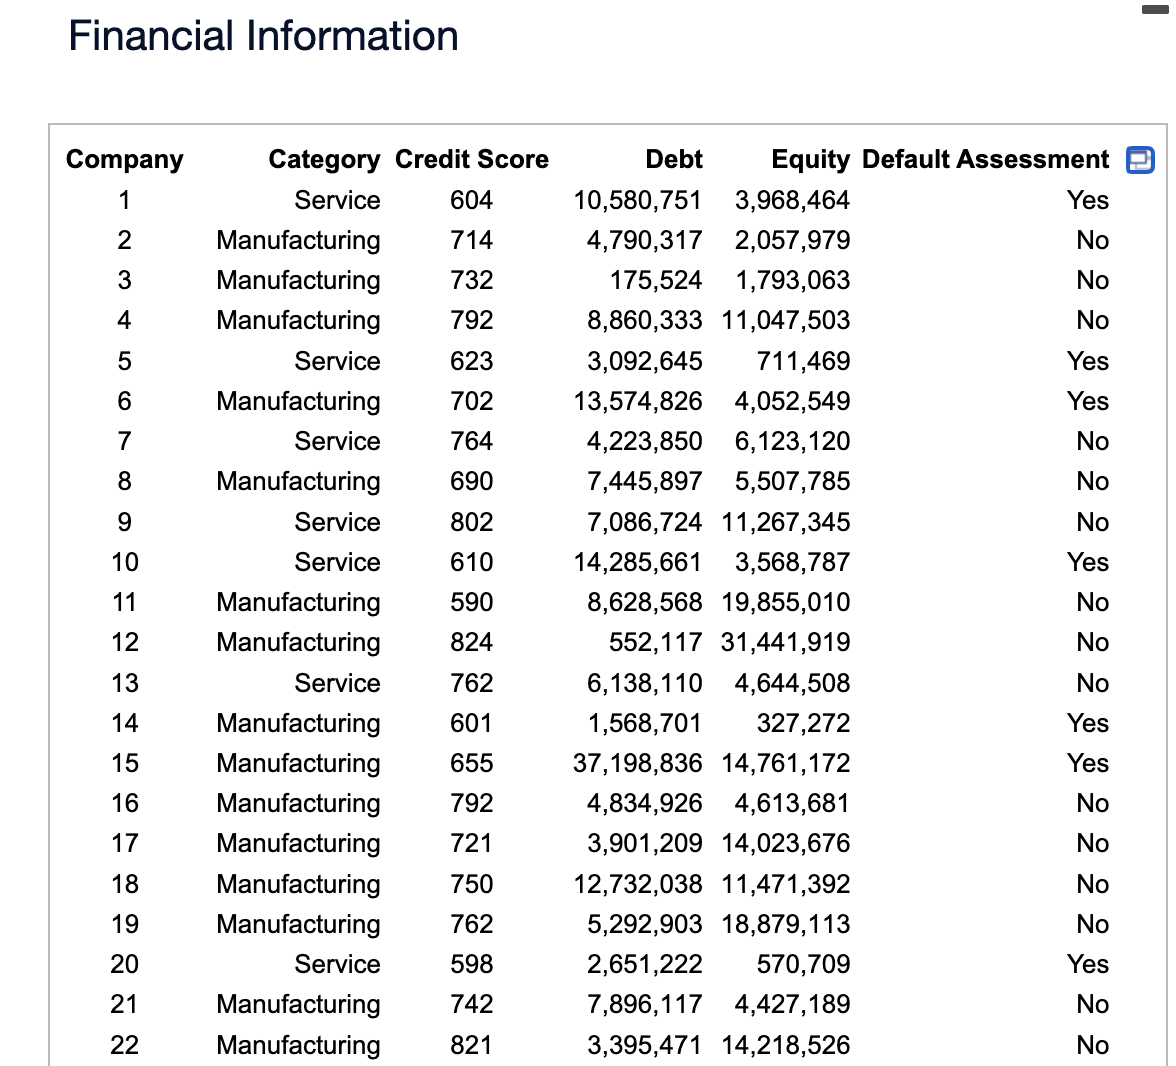
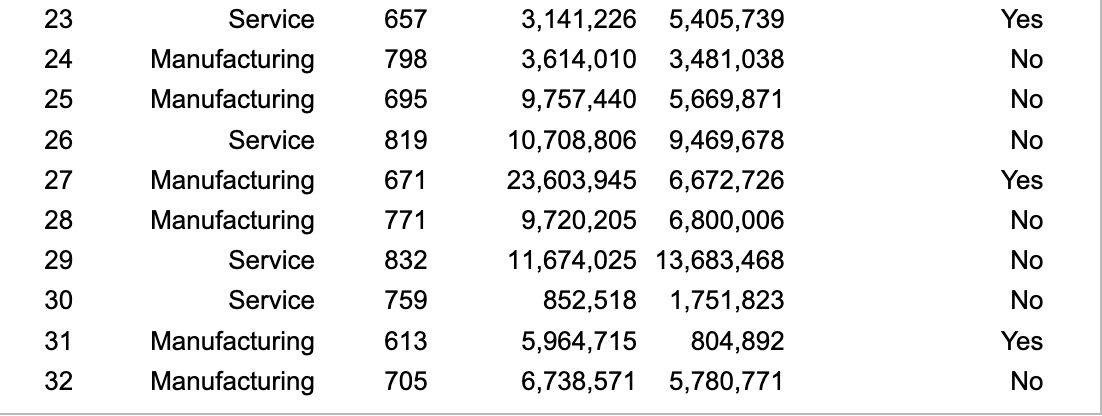
The database summarizes financial information for 32 companies and their perceived risk of default. Convert these data into an Excel table. Use table-based calculations to find the average debt and average equity for companies with a risk of default, and also for those without a risk of default. Does there appear to be a difference between companies with and without a risk of default?


Convert these data into an Excel table. Use table-based calculations to find the average debt for companies with a risk of default. The average debt for companies with a risk of default is $. (Round to the nearest whole number as needed.) Use table-based calculations to find the average debt for companies without a risk of default. The average debt for companies without a risk of default is $. (Round to the nearest whole number as needed.) Use table-based calculations to find the average equity for companies with a risk of default. The average equity for companies with a risk of default is $. (Round to the nearest whole number as needed.) Use table-based calculations to find the average equity for companies without a risk of default. The average equity for companies without a risk of default is $. (Round to the nearest whole number as needed.) Does there appear to be a difference between companies with and without a risk of default? A. Yes, companies with risk of default tend to have a lower debt and higher equity. B. No, there does not appear to be a difference between companies with and without risk of default. C. Yes, companies with risk of default tend to have a higher debt and lower equity. D. Yes, companies with risk of default tend to have a lower debt and lower equity. E. Yes, companies with risk of default tend to have a higher debt and higher equity. Financial Information Convert these data into an Excel table. Use table-based calculations to find the average debt for companies with a risk of default. The average debt for companies with a risk of default is $. (Round to the nearest whole number as needed.) Use table-based calculations to find the average debt for companies without a risk of default. The average debt for companies without a risk of default is $. (Round to the nearest whole number as needed.) Use table-based calculations to find the average equity for companies with a risk of default. The average equity for companies with a risk of default is $. (Round to the nearest whole number as needed.) Use table-based calculations to find the average equity for companies without a risk of default. The average equity for companies without a risk of default is $. (Round to the nearest whole number as needed.) Does there appear to be a difference between companies with and without a risk of default? A. Yes, companies with risk of default tend to have a lower debt and higher equity. B. No, there does not appear to be a difference between companies with and without risk of default. C. Yes, companies with risk of default tend to have a higher debt and lower equity. D. Yes, companies with risk of default tend to have a lower debt and lower equity. E. Yes, companies with risk of default tend to have a higher debt and higher equity. Financial Information


