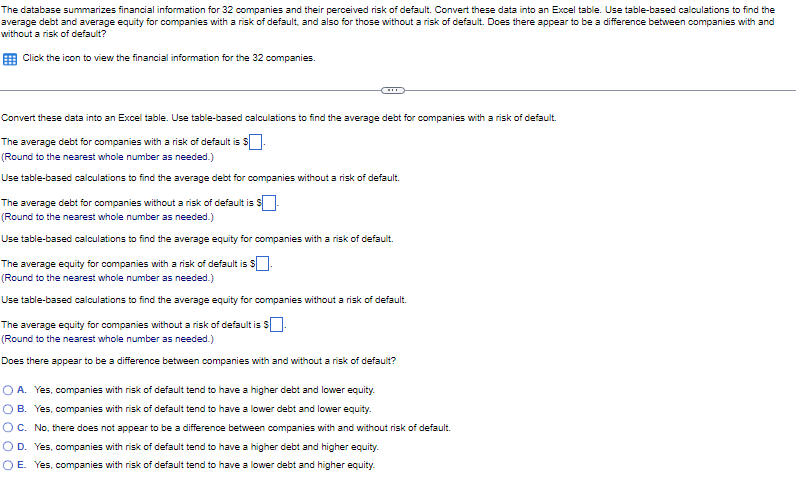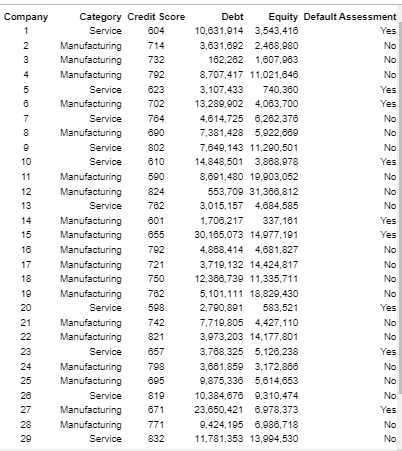


The database summarizes financial information for 32 companies and their perceived risk of default. Convert these data into an Excel table. Use table-based calculations to find the average debt and average equity for companies with a risk of default, and also for those without a risk of default. Does there appear to be a difference between companies with and without a risk of default? Click the icon to view the financial information for the 32 companies. Convert these data into an Excel table. Use table-based calculations to find the average debt for companies with a risk of default. The average debt for companies with a risk of default is (Round to the nearest whole number as needed.) Use table-based calculations to find the average debt for companies without a risk of default. The average debt for companies without a risk of default is $ (Round to the nearest whole number as needed.) Use table-based calculations to find the average equity for companies with a risk of default. The average equity for companies with a risk of default is $. (Round to the nearest whole number as needed.) Use table-based calculations to find the average equity for companies without a risk of default. The average equity for companies without a risk of default is $. (Round to the nearest whole number as needed.) Does there appear to be a difference between companies with and without a risk of default? O A. Yes, companies with risk of default tend to have a higher debt and lower equity. O B. Yes, companies with risk of default tend to have a lower debt and lower equity. O C. No, there does not appear to be a difference between companies with and without risk of default. OD. Yes, companies with risk of default tend to have a higher debt and higher equity. OE. Yes, companies with risk of default tend to have a lower debt and higher equity. Company 1 2 2344 3 4 1080 5 6 78 9 = 80 10 11 12 13 14 15 16 17 18 19 20 21 22 23 24 25 26 27 28 29 Category Credit Score Service 604 Manufacturing 714 Manufacturing 732 Manufacturing 792 Service 623 Manufacturing 702 Service 764 Manufacturing 690 Service 802 Service 610 Manufacturing 590 Manufacturing 824 Service 762 Manufacturing 601 Manufacturing 655 Manufacturing 792 Manufacturing 721 Manufacturing 750 Manufacturing 762 Service 598 Manufacturing 742 Manufacturing 821 Service 657 Manufacturing 798 Manufacturing 695 Service 819 Manufacturing 671 Manufacturing 771 Service 832 Debt 10,631,914 3,543,416 3,631,692 2,468,980 162,262 1,607,963 Equity Default Assessment 8,707,417 11,021,646 3,107,433 740,380 13,289,902 4,063,700 4,614,725 6,262,376 7,381,428 5,922,669 7,649,143 11,290,501 14,848,501 3,888,978 8,691,480 19,903,052 553,709 31,386,812 3,015,157 4,684,585 1,706,217 337,161 30,165,073 14,977,191 4,888,414 4,681,827 3,719,132 14,424,817 12,366,739 11,335,711 5,101,111 18,829,430 2,790,891 583,521 7,719,805 4,427,110 3,973,203 14,177,801 3,788,325 5,126,238 3,661,859 3,172,886 9,875,336 5,614,653 10,384,676 9,310,474 23,650,421 6,978,373 9,424,195 6,986,718 11,781,353 13,994,530 Yes No No No Yes Yes No No No Yes No No No Yes Yes No No No No Yes No No Yes No No No Yes No No 30 31 32 Service 759 613 705 Manufacturing Manufacturing 826,521 1,595,264 5,946,075 840,936 6,901,143 5,691,984 No Yes No The database summarizes financial information for 32 companies and their perceived risk of default. Convert these data into an Excel table. Use table-based calculations to find the average debt and average equity for companies with a risk of default, and also for those without a risk of default. Does there appear to be a difference between companies with and without a risk of default? Click the icon to view the financial information for the 32 companies. Convert these data into an Excel table. Use table-based calculations to find the average debt for companies with a risk of default. The average debt for companies with a risk of default is (Round to the nearest whole number as needed.) Use table-based calculations to find the average debt for companies without a risk of default. The average debt for companies without a risk of default is $ (Round to the nearest whole number as needed.) Use table-based calculations to find the average equity for companies with a risk of default. The average equity for companies with a risk of default is $. (Round to the nearest whole number as needed.) Use table-based calculations to find the average equity for companies without a risk of default. The average equity for companies without a risk of default is $. (Round to the nearest whole number as needed.) Does there appear to be a difference between companies with and without a risk of default? O A. Yes, companies with risk of default tend to have a higher debt and lower equity. O B. Yes, companies with risk of default tend to have a lower debt and lower equity. O C. No, there does not appear to be a difference between companies with and without risk of default. OD. Yes, companies with risk of default tend to have a higher debt and higher equity. OE. Yes, companies with risk of default tend to have a lower debt and higher equity. Company 1 2 2344 3 4 1080 5 6 78 9 = 80 10 11 12 13 14 15 16 17 18 19 20 21 22 23 24 25 26 27 28 29 Category Credit Score Service 604 Manufacturing 714 Manufacturing 732 Manufacturing 792 Service 623 Manufacturing 702 Service 764 Manufacturing 690 Service 802 Service 610 Manufacturing 590 Manufacturing 824 Service 762 Manufacturing 601 Manufacturing 655 Manufacturing 792 Manufacturing 721 Manufacturing 750 Manufacturing 762 Service 598 Manufacturing 742 Manufacturing 821 Service 657 Manufacturing 798 Manufacturing 695 Service 819 Manufacturing 671 Manufacturing 771 Service 832 Debt 10,631,914 3,543,416 3,631,692 2,468,980 162,262 1,607,963 Equity Default Assessment 8,707,417 11,021,646 3,107,433 740,380 13,289,902 4,063,700 4,614,725 6,262,376 7,381,428 5,922,669 7,649,143 11,290,501 14,848,501 3,888,978 8,691,480 19,903,052 553,709 31,386,812 3,015,157 4,684,585 1,706,217 337,161 30,165,073 14,977,191 4,888,414 4,681,827 3,719,132 14,424,817 12,366,739 11,335,711 5,101,111 18,829,430 2,790,891 583,521 7,719,805 4,427,110 3,973,203 14,177,801 3,788,325 5,126,238 3,661,859 3,172,886 9,875,336 5,614,653 10,384,676 9,310,474 23,650,421 6,978,373 9,424,195 6,986,718 11,781,353 13,994,530 Yes No No No Yes Yes No No No Yes No No No Yes Yes No No No No Yes No No Yes No No No Yes No No 30 31 32 Service 759 613 705 Manufacturing Manufacturing 826,521 1,595,264 5,946,075 840,936 6,901,143 5,691,984 No Yes No


