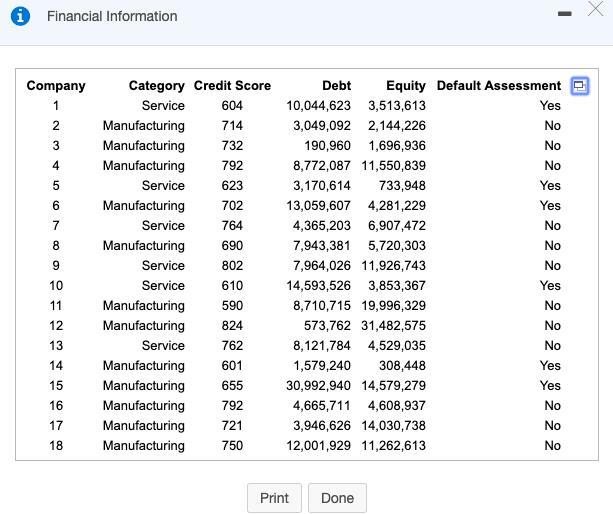
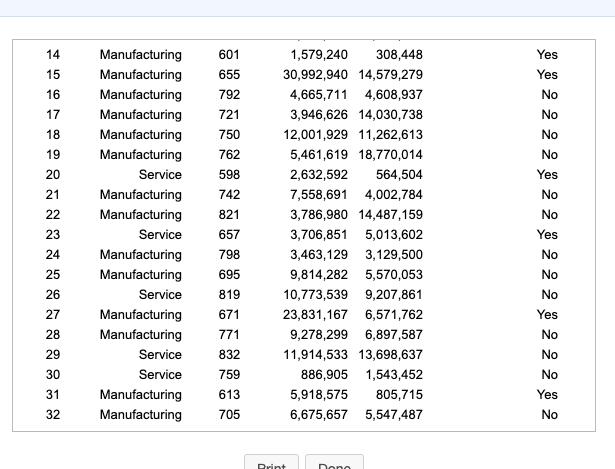
Question: The database below summarizes financial information for 32 companies and their perceived risk of default. Convert these data into an Excel table. Use table-based calculations
The database below summarizes financial information for 32 companies and their perceived risk of default. Convert these data into an Excel table. Use table-based calculations to find the average debt and average equity for companies with a risk of default, and also for those without a risk of default. Does there appear to be a difference between companies with and without a risk of default?
The average debt for companies with a risk of default is ____
The average debt for companies without risk of default is ____
The average debt for companies with a risk of default is ____
The average debt for companies without a risk of default is ______


1 Financial Information Company Category Credit Score Debt Equity Default Assessment e 1 Service 604 10,044,623 3,513,613 Yes Manufacturing 714 3,049,092 2,144,226 No 3 Manufacturing 732 190,960 1,696,936 No 4 Manufacturing 792 8,772,087 11,550,839 No Service 623 3,170,614 733,948 Yes 6 Manufacturing 702 13,059,607 4,281,229 Yes 7 Service 764 4,365,203 6,907,472 No Manufacturing 690 7,943,381 5,720,303 No 9 Service 802 7,964,026 11,926,743 No 10 Service 610 14,593,526 3,853,367 Yes 11 Manufacturing 590 8,710,715 19,996,329 No 12 Manufacturing 824 573,762 31,482,575 No 13 Service 762 8,121,784 4,529,035 No 14 Manufacturing 601 1,579,240 308,448 Yes 15 Manufacturing 655 30,992,940 14,579,279 Yes 16 Manufacturing 792 4,665,711 4,608,937 No 17 Manufacturing 721 3,946,626 14,030,738 No 18 Manufacturing 750 12,001,929 11,262,613 No Print Done
Step by Step Solution
3.50 Rating (150 Votes )
There are 3 Steps involved in it

Get step-by-step solutions from verified subject matter experts


