

Answered step by step
Verified Expert Solution
Question
1 Approved Answer
The Dataset The dataset we will be using is called MNIST. This is a large collection of handdrawn digits 0-9 and is a good dataset
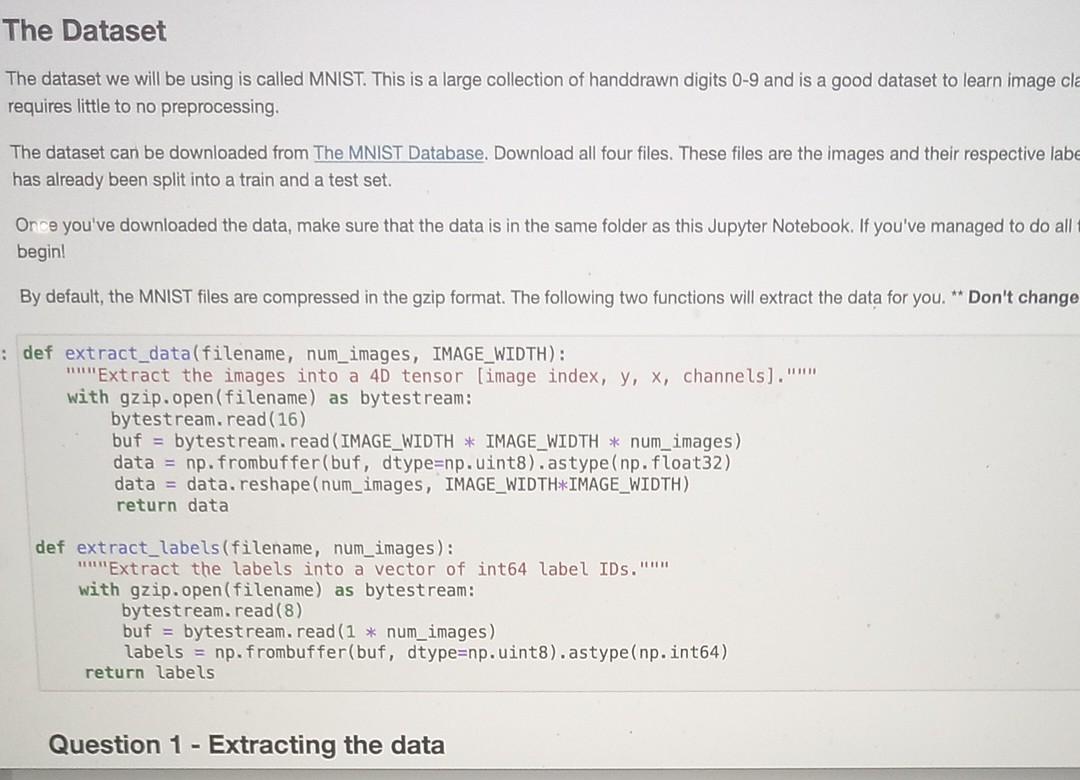
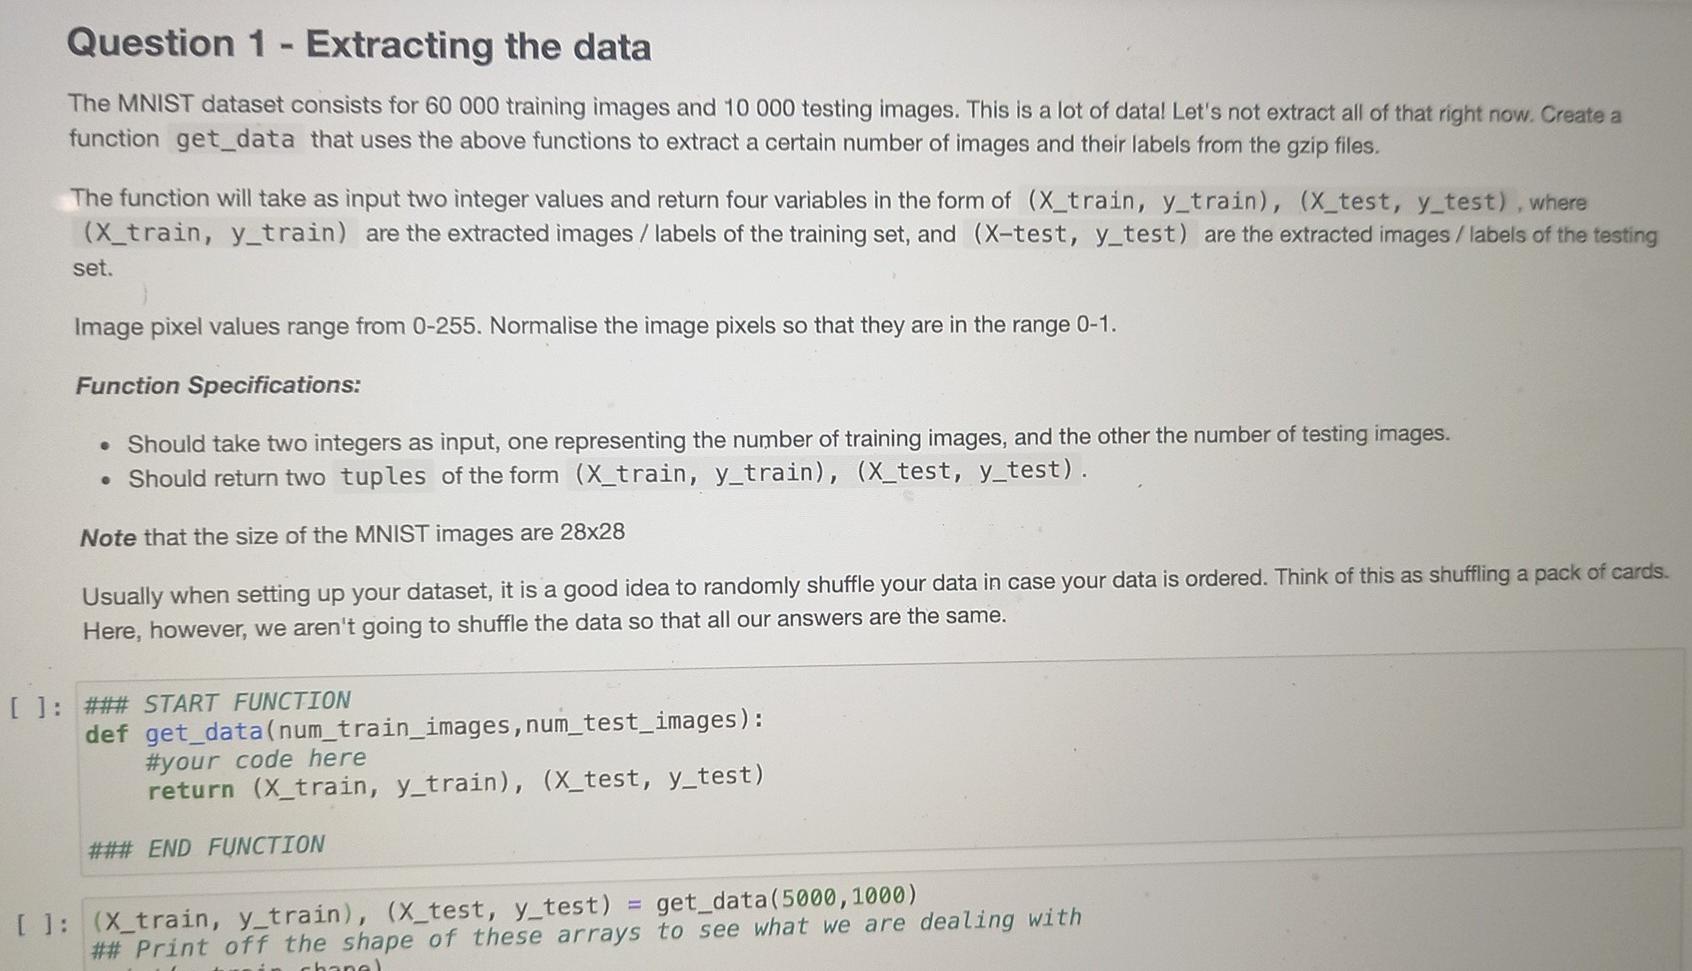
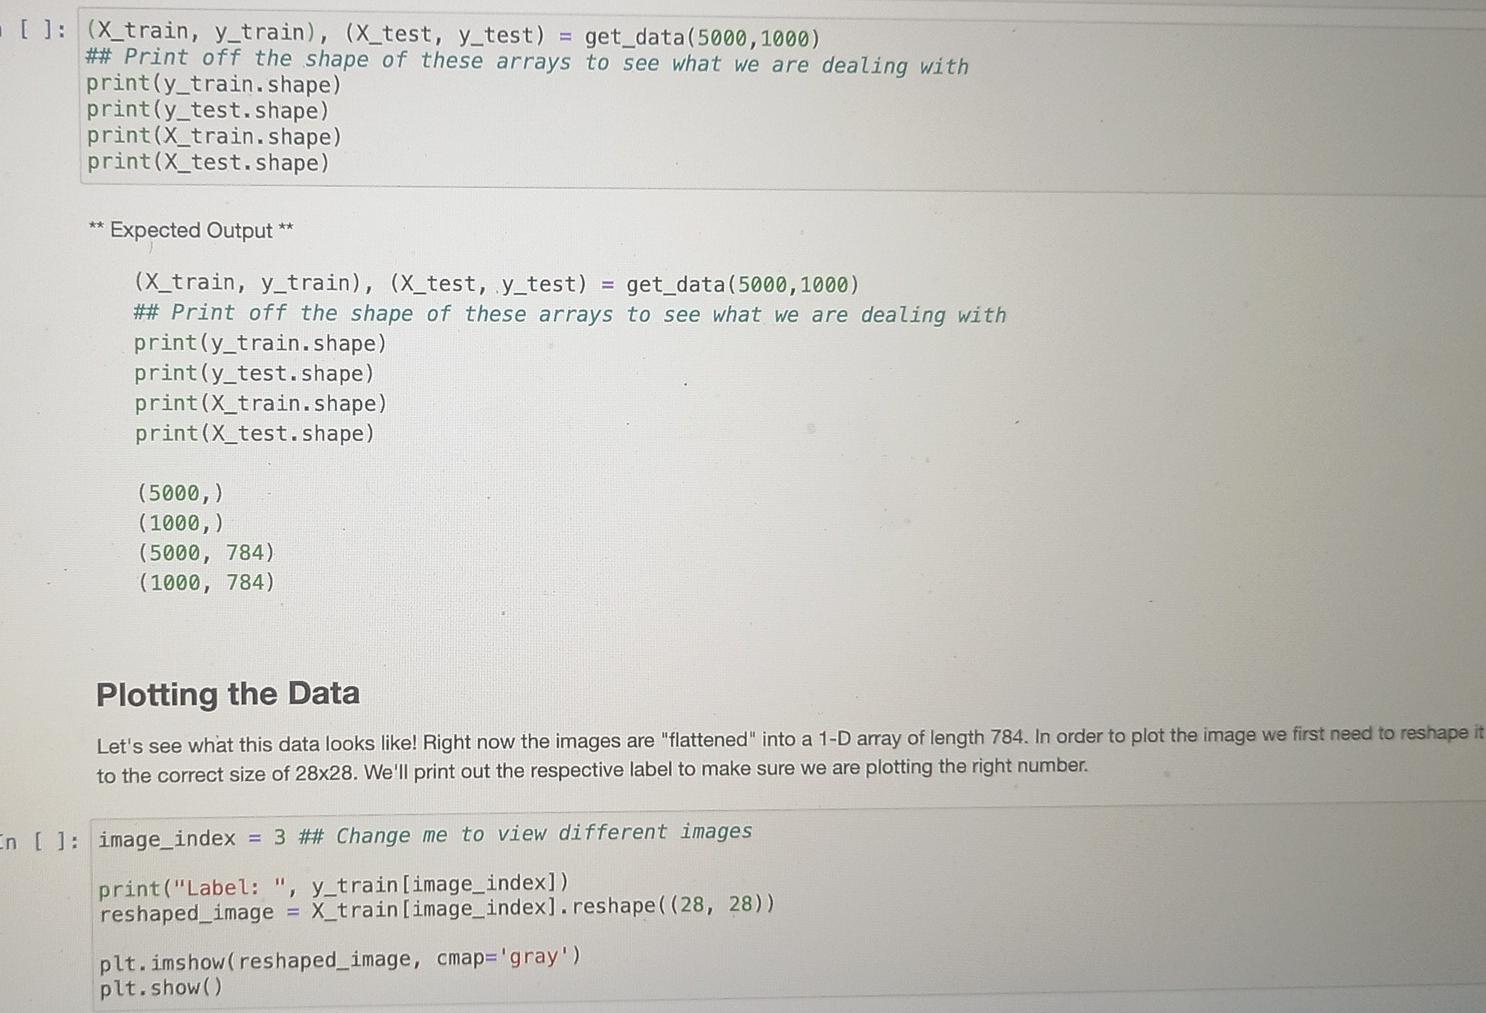
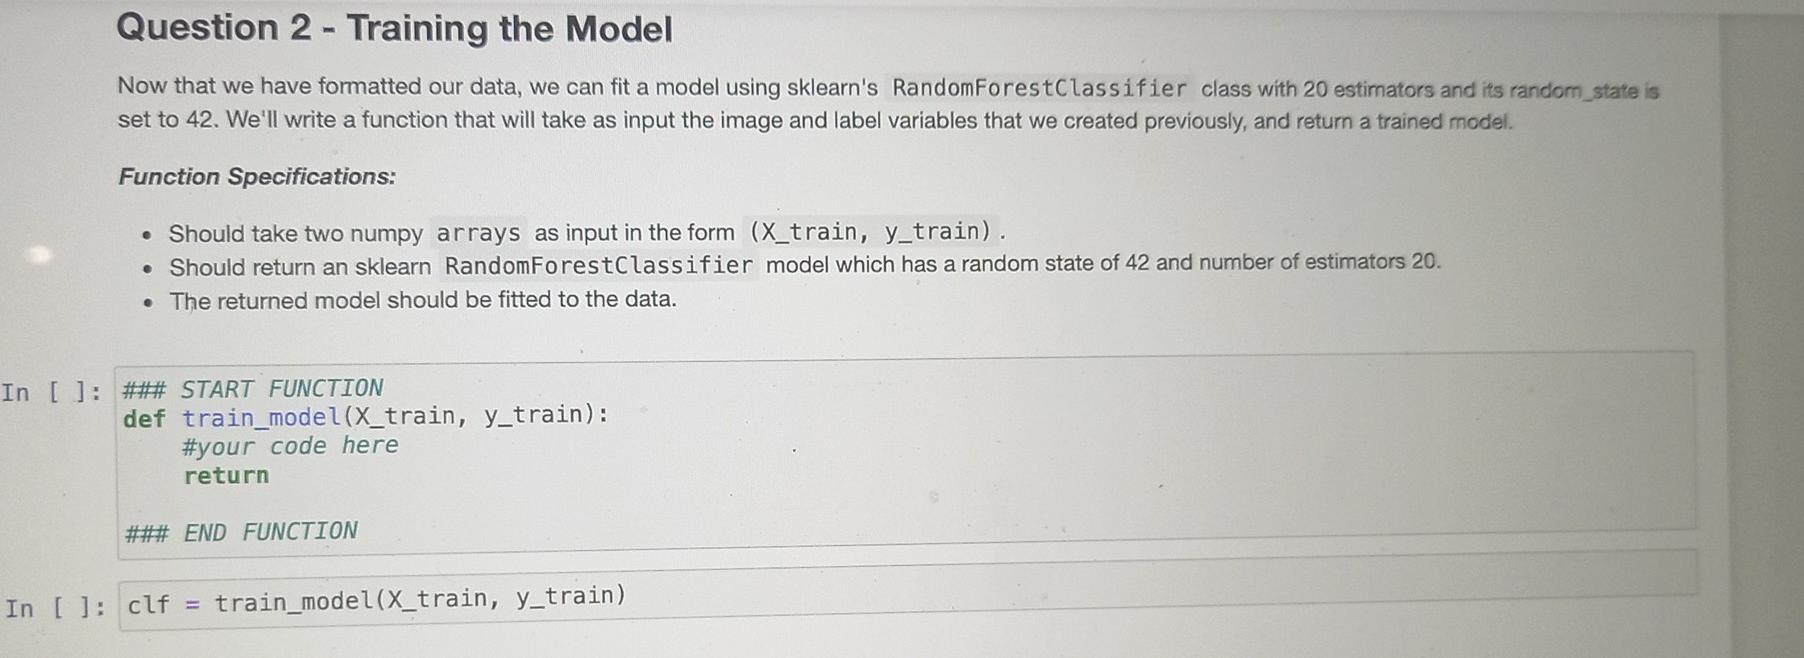
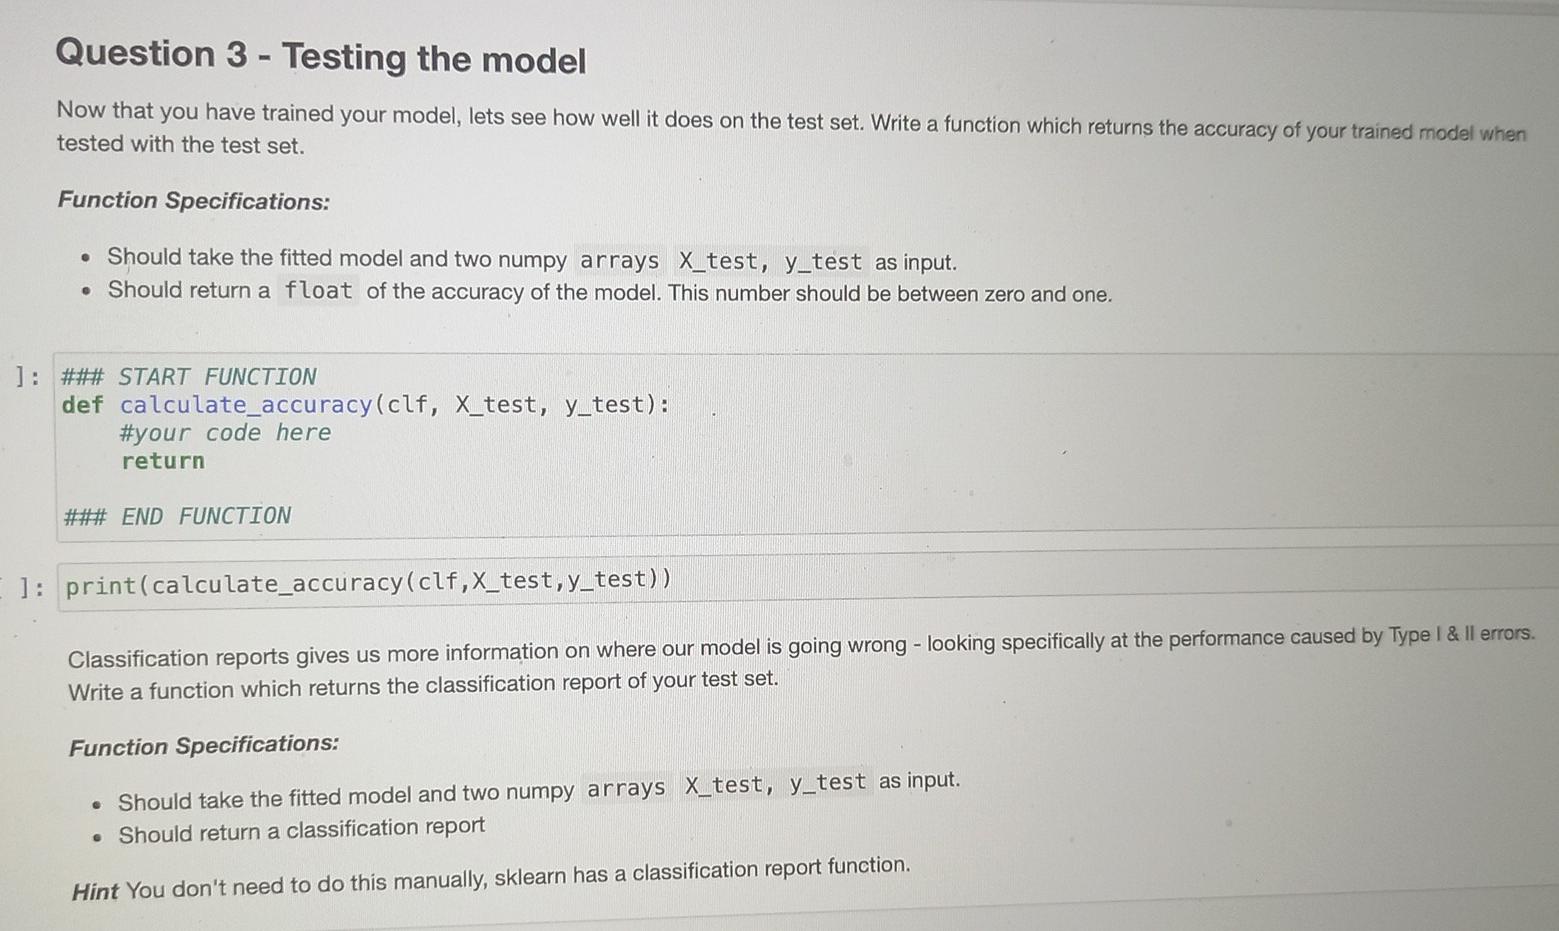
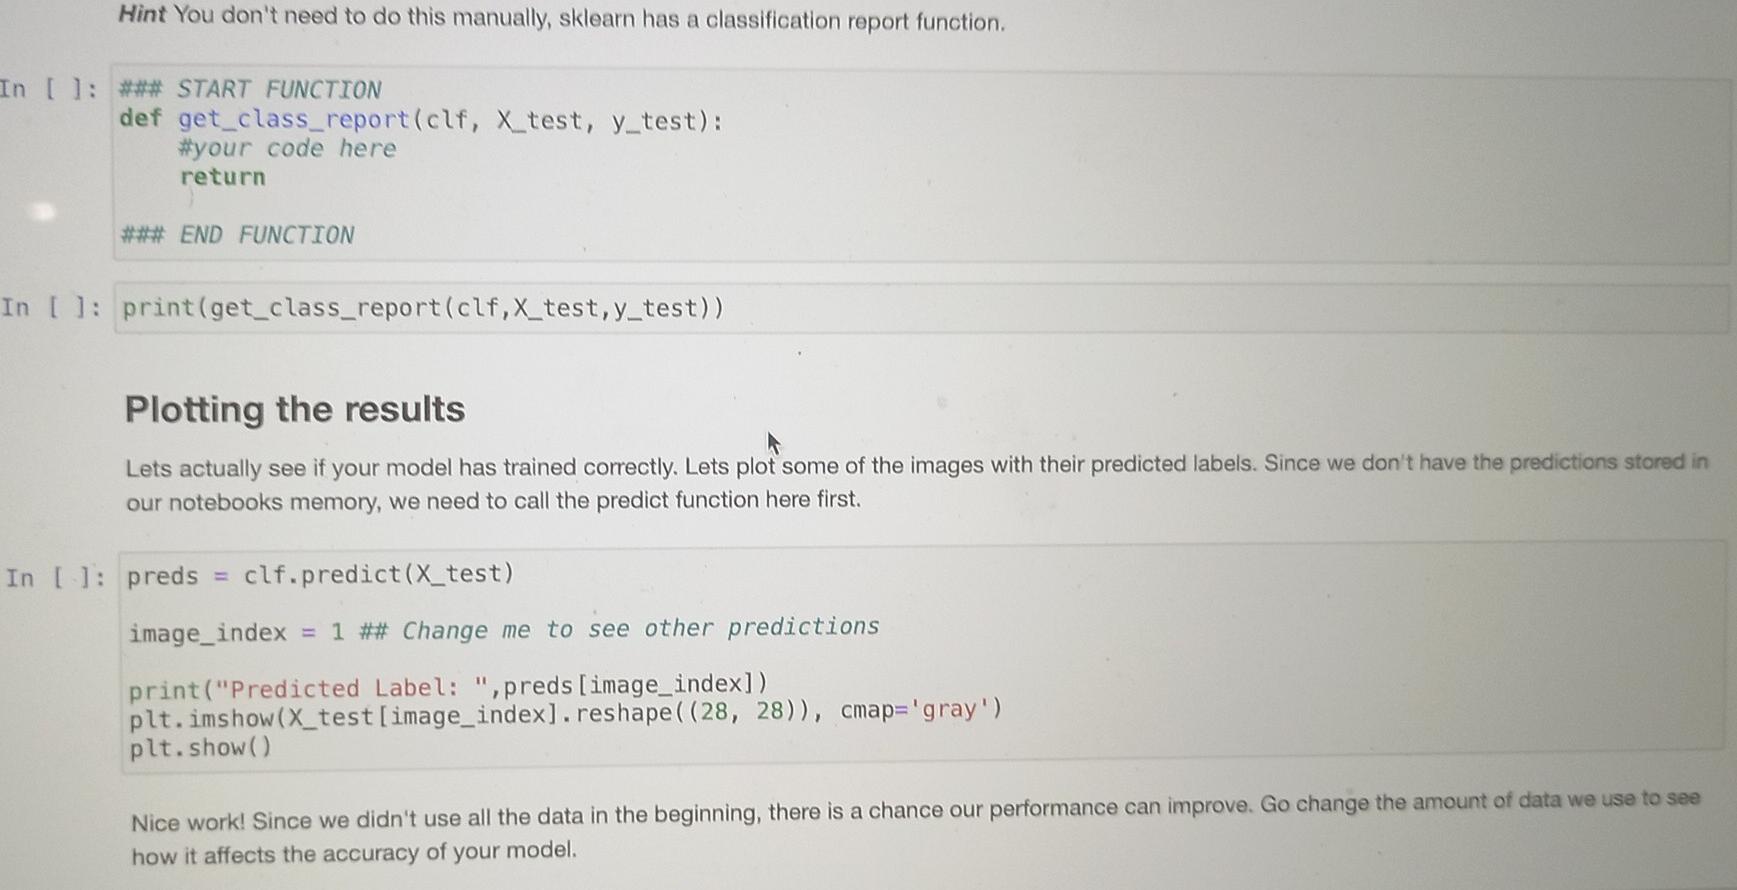
The Dataset The dataset we will be using is called MNIST. This is a large collection of handdrawn digits 0-9 and is a good dataset to learn image cla requires little to no preprocessing, The dataset can be downloaded from The MNIST Database. Download all four files. These files are the images and their respective labe has already been split into a train and a test set. Once you've downloaded the data, make sure that the data is in the same folder as this Jupyter Notebook. If you've managed to do all begin! By default, the MNIST files are compressed in the gzip format. The following two functions will extract the data for you. ** Don't change : def extract_data(filename, num_images, IMAGE_WIDTH): "Extract the images into a 40 tensor (image index, y, x, channels)." with gzip.open(filename) as bytestream: bytestream.read(16) buf = bytestream.read (IMAGE_WIDTH * IMAGE_WIDTH * num_images) data = np.frombuffer(buf, dtype=np. uint8).astype (np. float32) data = data.reshape(num_images, IMAGE_WIDTH*IMAGE_WIDTH) return data def extract_labels(filename, num_images): Extract the labels into a vector of int64 label IDs." with gzip.open(filename) as bytestream: bytestream.read(8) buf = bytestream.read(1 * num_images) labels = np. frombuffer(buf, dtype=np. uint8).astype(np. int64) return labels Question 1 - Extracting the data Question 1 - Extracting the data The MNIST dataset consists for 60 000 training images and 10 000 testing images. This is a lot of datal Let's not extract all of that right now. Create a function get_data that uses the above functions to extract a certain number of images and their labels from the gzip files. The function will take as input two integer values and return four variables in the form of (X_train, y_train), (x_test, y_test), where (X_train, y_train) are the extracted images / labels of the training set, and (X-test, y_test) are the extracted images / labels of the testing set. Image pixel values range from 0-255. Normalise the image pixels so that they are in the range 0-1. Function Specifications: Should take two integers as input, one representing the number of training images, and the other the number of testing images. Should return two tuples of the form (X_train, y_train), (x_test, y_test). Note that the size of the MNIST images are 28x28 Usually when setting up your dataset, it is a good idea to randomly shuffle your data in case your data is ordered. Think of this as shuffling a pack of cards. Here, however, we aren't going to shuffle the data so that all our answers are the same. [ ]: ### START FUNCTION def get_data(num_train_images, num_test_images): #your code here return (X_train, y_train), (X_test, y_test) ### END FUNCTION []: (X_train, y_train), (X_test, y_test) get_data(5000, 1000) ## Print off the shape of these arrays to see what we are dealing with chanel []: (X_train, y_train), (X_test, y_test) = get_data(5000, 1000) ## Print off the shape of these arrays to see what we are dealing with print(y_train.shape) print(y_test. shape) print(X_train.shape) print(X_test. shape) ** Expected Output (X_train, y_train), (X_test, y_test) = get_data(5000, 1000) ## Print off the shape of these arrays to see what we are dealing with print(y_train.shape) print(y_test.shape) print(X_train.shape) print(X_test. shape) (5000,) (1000,) (5000, 784) (1000, 784) Plotting the Data Let's see what this data looks like! Right now the images are "flattened" into a 1-D array of length 784. In order to plot the image we first need to reshape it to the correct size of 28x28. We'll print out the respective label to make sure we are plotting the right number. En [ ]: image_index = 3 ## Change me to view different images print("Label: ", y_train[image_index]) reshaped_image = X_train[image_index]. reshape ((28, 28)) plt.imshow(reshaped_image, cmap='gray') plt.show(). Question 2 - Training the Model Now that we have formatted our data, we can fit a model using sklearn's RandomForestClassifier class with 20 estimators and its random_state is set to 42. We'll write a function that will take as input the image and label variables that we created previously, and return a trained model. Function Specifications: Should take two numpy arrays as input in the form (X_train, y_train). Should return an sklearn RandomForestClassifier model which has a random state of 42 and number of estimators 20. The returned model should be fitted to the data. In [ ]: ### START FUNCTION def train_model(X_train, y_train): #your code here return ### END FUNCTION In [ ]: clf train_model(X_train, y_train) Question 3 - Testing the model Now that you have trained your model, lets see how well it does on the test set. Write a function which returns the accuracy of your trained model when tested with the test set. Function Specifications: Should take the fitted model and two numpy arrays X_test, y_test as input. Should return a float of the accuracy of the model. This number should be between zero and one. : ### START FUNCTION def calculate_accuracy(clf, X_test, y_test): #your code here return ### END FUNCTION 1: print(calculate_accuracy(clf,x_test,y_test)) Classification reports gives us more information on where our model is going wrong - looking specifically at the performance caused by Type I & Il errors. Write a function which returns the classification report of your test set. Function Specifications: Should take the fitted model and two numpy arrays X_test, y_test as input. Should return a classification report Hint You don't need to do this manually, sklearn has a classification report function. Hint You don't need to do this manually, sklearn has a classification report function. In [ ]: *** START FUNCTION def get_class_report(clf, X_test, y_test): #your code here return #*# END FUNCTION In [ 1: print(get_class_report(clf,x_test,y_test)) Plotting the results the predictions stored in Lets actually see if your model has trained correctly. Lets plot some of the images with their predicted labels. Since we don't hav our notebooks memory, we need to call the predict function here first. In [ ]: preds clf.predict(X_test) image_index = 1 ## Change me to see other predictions print("Predicted Label: ",preds [image_index]) plt.imshow(X_test[image_index]. reshape ((28, 28)), cmap='gray') plt.show() a Nice work! Since we didn't use all the data in the beginning, there is a chance our performance can improve. Go change the amount of data we use to see how it affects the accuracy of your model
Step by Step Solution
There are 3 Steps involved in it
Step: 1

Get Instant Access to Expert-Tailored Solutions
See step-by-step solutions with expert insights and AI powered tools for academic success
Step: 2

Step: 3
Ace Your Homework with AI
Get the answers you need in no time with our AI-driven, step-by-step assistance
Get Started
MongoDB 4 Quick Start Guide Learn The Skills You Need To Work With The World S Most Popular NoSQL Database
Authors: Doug Bierer
1st Edition
1789343534, 978-1789343533