Answered step by step
Verified Expert Solution
Question
1 Approved Answer
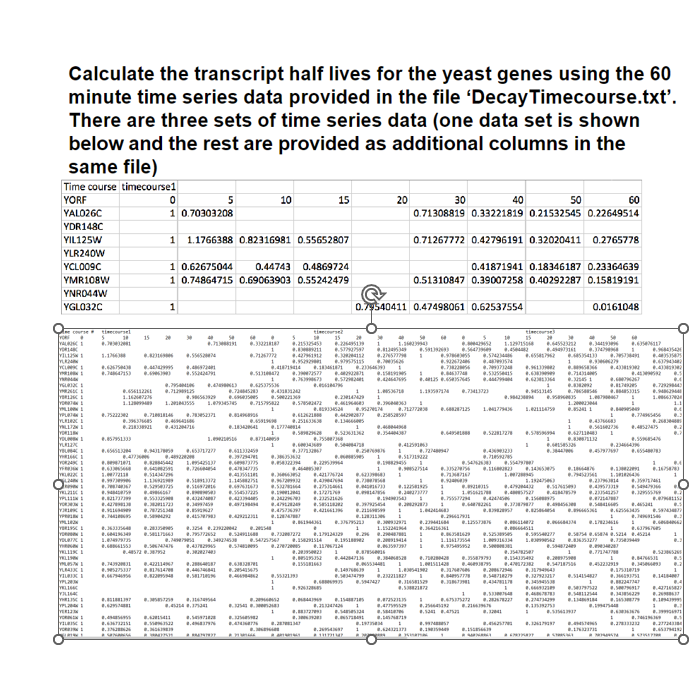
The datashows the time course data showing the relative expression levels of the yeast transcripts at different time points ( 0 to 6 0 mins
The datashows the time course data showing the relative expression levels of the yeast transcripts at different time points to mins in intervals of min in tabdelimited text format. Since the transcripts are decaying, their levels at various time points are lower than what they appear at mins which itself is normalized to
Also, note that some transcripts do not have any data expression value across all the time points because there is no corresponding probe that could be mapped to it and these can be ignored for the analysis. Could this be performed in R

Step by Step Solution
There are 3 Steps involved in it
Step: 1

Get Instant Access to Expert-Tailored Solutions
See step-by-step solutions with expert insights and AI powered tools for academic success
Step: 2

Step: 3

Ace Your Homework with AI
Get the answers you need in no time with our AI-driven, step-by-step assistance
Get Started


