The department director's meeting had not led to the outcome Anna Quintero wanted. Neither the CMO nor the department directors were fully convinced by


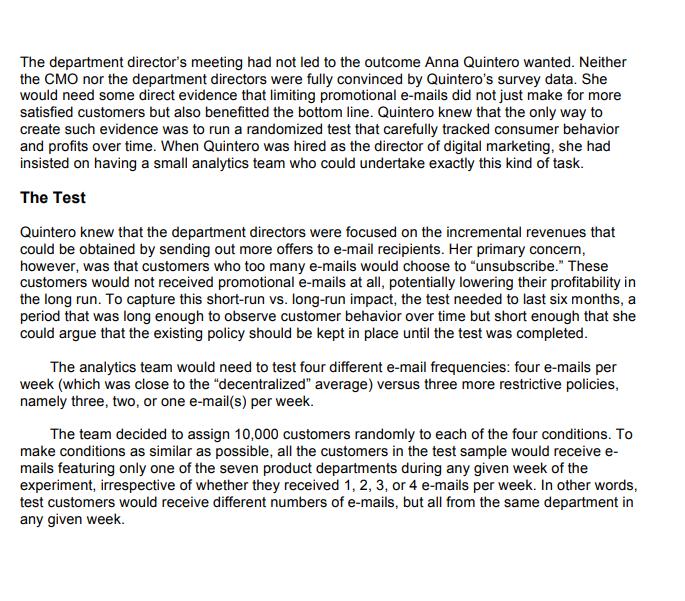
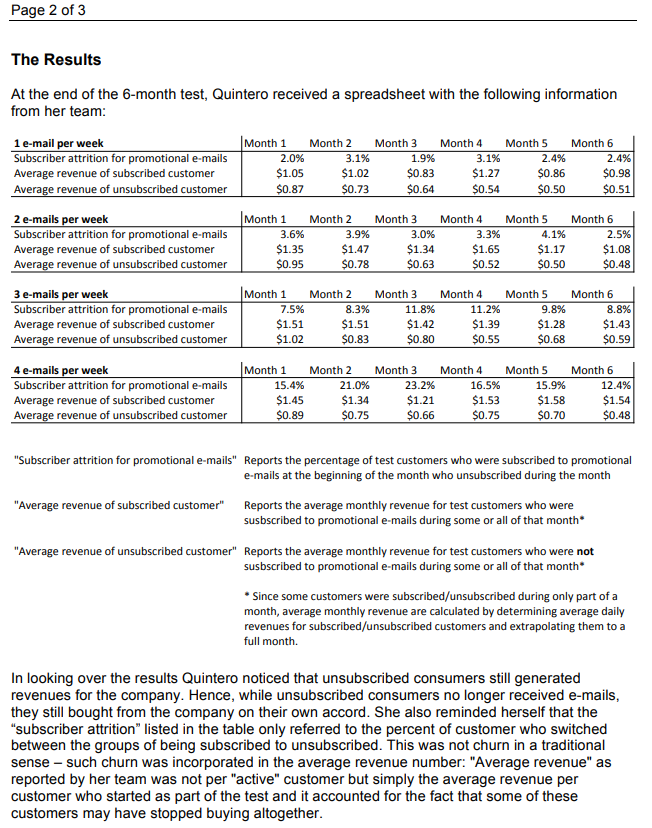
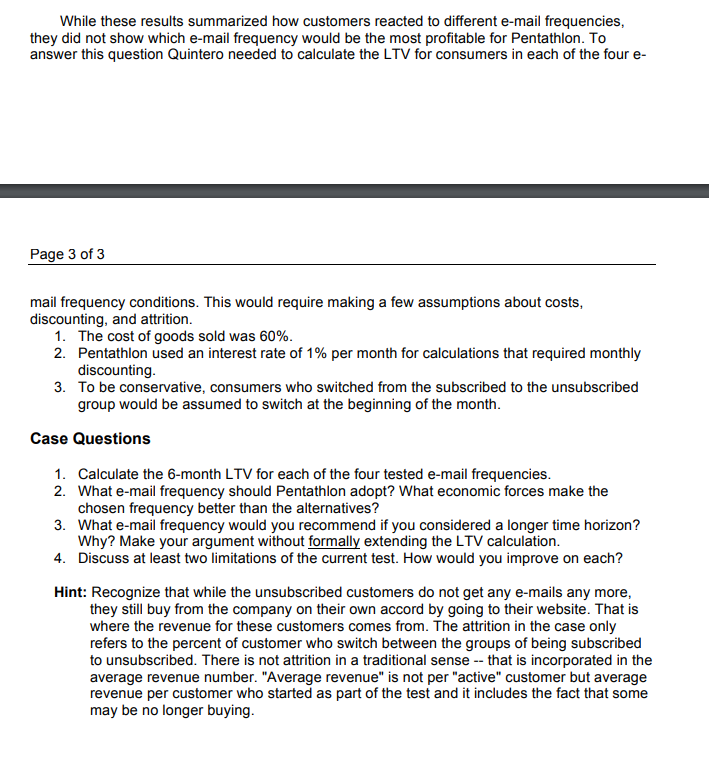
The department director's meeting had not led to the outcome Anna Quintero wanted. Neither the CMO nor the department directors were fully convinced by Quintero's survey data. She would need some direct evidence that limiting promotional e-mails did not just make for more satisfied customers but also benefitted the bottom line. Quintero knew that the only way to create such evidence was to run a randomized test that carefully tracked consumer behavior and profits over time. When Quintero was hired as the director of digital marketing, she had insisted on having a small analytics team who could undertake exactly this kind of task. The Test Quintero knew that the department directors were focused on the incremental revenues that could be obtained by sending out more offers to e-mail recipients. Her primary concern, however, was that customers who too many e-mails would choose to "unsubscribe." These customers would not received promotional e-mails at all, potentially lowering their profitability in the long run. To capture this short-run vs. long-run impact, the test needed to last six months, a period that was long enough to observe customer behavior over time but short enough that she could argue that the existing policy should be kept in place until the test was completed. The analytics team would need to test four different e-mail frequencies: four e-mails per week (which was close to the "decentralized" average) versus three more restrictive policies, namely three, two, or one e-mail(s) per week. The team decided to assign 10,000 customers randomly to each of the four conditions. To make conditions as similar as possible, all the customers in the test sample would receive e- mails featuring only one of the seven product departments during any given week of the experiment, irrespective of whether they received 1, 2, 3, or 4 e-mails per week. In other words, test customers would receive different numbers of e-mails, but all from the same department in any given week. Page 2 of 3 The Results At the end of the 6-month test, Quintero received a spreadsheet with the following information from her team: 1 e-mail per week Subscriber attrition for promotional e-mails Average revenue of subscribed customer Average revenue of unsubscribed customer 2 e-mails per week Subscriber attrition for promotional e-mails Average revenue of subscribed customer Average revenue of unsubscribed customer 3 e-mails per week Subscriber attrition for promotional e-mails Average revenue of subscribed customer Average revenue of unsubscribed customer 4 e-mails per week Subscriber attrition for promotional e-mails Average revenue of subscribed customer Average revenue of unsubscribed customer Month 1 Month 2 Month 3 Month 4 Month 5 Month 6 2.0% 3.1% 1.9% 3.1% 2.4% 2.4% $1.05 $1.02 $0.83 $1.27 $0.86 $0.98 $0.87 $0.73 $0.64 $0.54 $0.50 $0.51 Month 1 Month 2 Month 3 Month 4 Month 5 Month 6 3.6% 3.9% 3.0% 3.3% 4.1% 2.5% $1.35 $1.47 $1.34 $1.65 $1.17 $1.08 $0.95 $0.78 $0.63 $0.52 $0.50 $0.48 Month 1 Month 2 Month 3 Month 4 Month 5 Month 6 7.5% 8.3% 11.8% 11.2% 9.8% 8.8% $1.51 $1.51 $1.42 $1.39 $1.28 $1.43 $1.02 $0.83 $0.80 $0.55 $0.68 $0.59 Month 1 Month 2 Month 3 Month 4 Month 5 Month 6 15.4% 21.0% 23.2% 16.5% 15.9% 12.4% $1.45 $1.34 $1.21 $1.53 $1.58 $1.54 $0.89 $0.75 $0.66 $0.75 $0.70 $0.48 "Subscriber attrition for promotional e-mails" Reports the percentage of test customers who were subscribed to promotional e-mails at the beginning of the month who unsubscribed during the month "Average revenue of subscribed customer" Reports the average monthly revenue for test customers who were susbscribed to promotional e-mails during some or all of that month* "Average revenue of unsubscribed customer" Reports the average monthly revenue for test customers who were not susbscribed to promotional e-mails during some or all of that month* Since some customers were subscribed/unsubscribed during only part of a month, average monthly revenue are calculated by determining average daily revenues for subscribed/unsubscribed customers and extrapolating them to a full month. In looking over the results Quintero noticed that unsubscribed consumers still generated revenues for the company. Hence, while unsubscribed consumers no longer received e-mails, they still bought from the company on their own accord. She also reminded herself that the "subscriber attrition" listed in the table only referred to the percent of customer who switched between the groups of being subscribed to unsubscribed. This was not churn in a traditional sense-such churn was incorporated in the average revenue number: "Average revenue" as reported by her team was not per "active" customer but simply the average revenue per customer who started as part of the test and it accounted for the fact that some of these customers may have stopped buying altogether. While these results summarized how customers reacted to different e-mail frequencies, they did not show which e-mail frequency would be the most profitable for Pentathlon. To answer this question Quintero needed to calculate the LTV for consumers in each of the four e- Page 3 of 3 mail frequency conditions. This would require making a few assumptions about costs, discounting, and attrition. 1. The cost of goods sold was 60%. 2. Pentathlon used an interest rate of 1% per month for calculations that required monthly discounting. 3. To be conservative, consumers who switched from the subscribed to the unsubscribed group would be assumed to switch at the beginning of the month. Case Questions 1. Calculate the 6-month LTV for each of the four tested e-mail frequencies. 2. What e-mail frequency should Pentathlon adopt? What economic forces make the chosen frequency better than the alternatives? 3. What e-mail frequency would you recommend if you considered a longer time horizon? Why? Make your argument without formally extending the LTV calculation. 4. Discuss at least two limitations of the current test. How would you improve on each? Hint: Recognize that while the unsubscribed customers do not get any e-mails any more, they still buy from the company on their own accord by going to their website. That is where the revenue for these customers comes from. The attrition in the case only refers to the percent of customer who switch between the groups of being subscribed to unsubscribed. There is not attrition in a traditional sense -- that is incorporated in the average revenue number. "Average revenue" is not per "active" customer but average revenue per customer who started as part of the test and it includes the fact that some may be no longer buying.
Step by Step Solution
There are 3 Steps involved in it
Step: 1

See step-by-step solutions with expert insights and AI powered tools for academic success
Step: 2

Step: 3

Ace Your Homework with AI
Get the answers you need in no time with our AI-driven, step-by-step assistance
Get Started


