Question
The dependent variable is absenteeism (ABSENT). The explanatory variable is seniority (SENIOR). The goal is to express the relationship between absenteeism and seniority in the
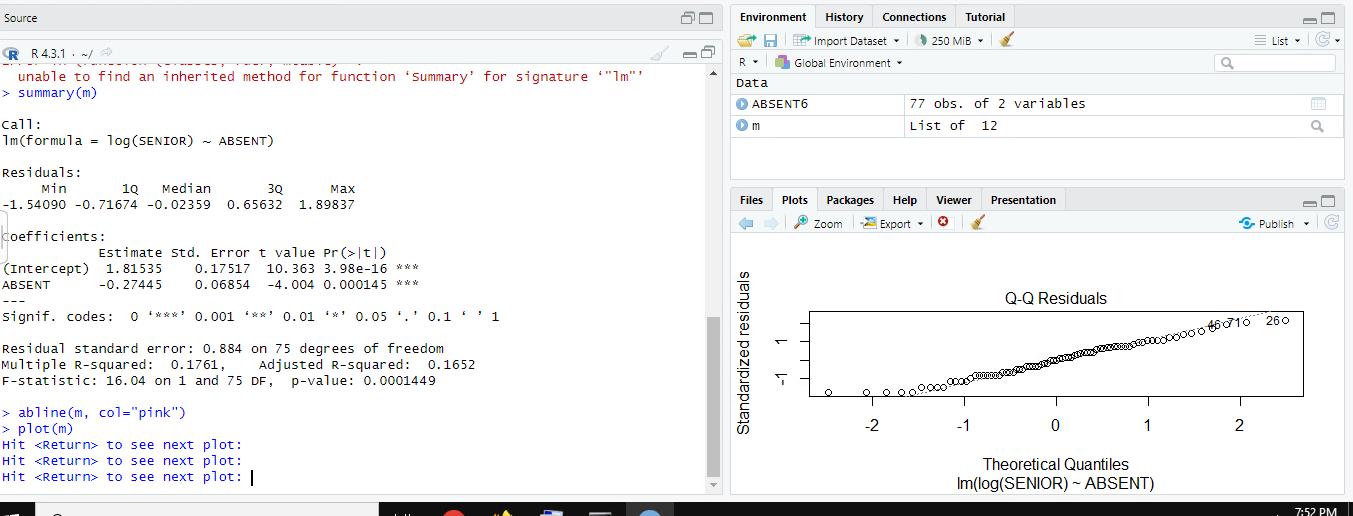
The dependent variable is absenteeism (ABSENT). The explanatory variable is seniority (SENIOR). The goal is to express the relationship between absenteeism and seniority in the form of an equation. Based on an examination of scatterplots and residual plots, do any assumptions of the linear regression model appear to be violated? If so, which one (or ones)? If any violations are detected, suggest possible corrections. Rerun the regression with the suggested corrections and compare your results to the original results. Be sure to do residual pots for the model using the suggested correction. Which model do you prefer and why?
The FOLLOWING IMAGES ARE OF THE VARIOUS PLOTS AND SUMMARY INFORMATION:
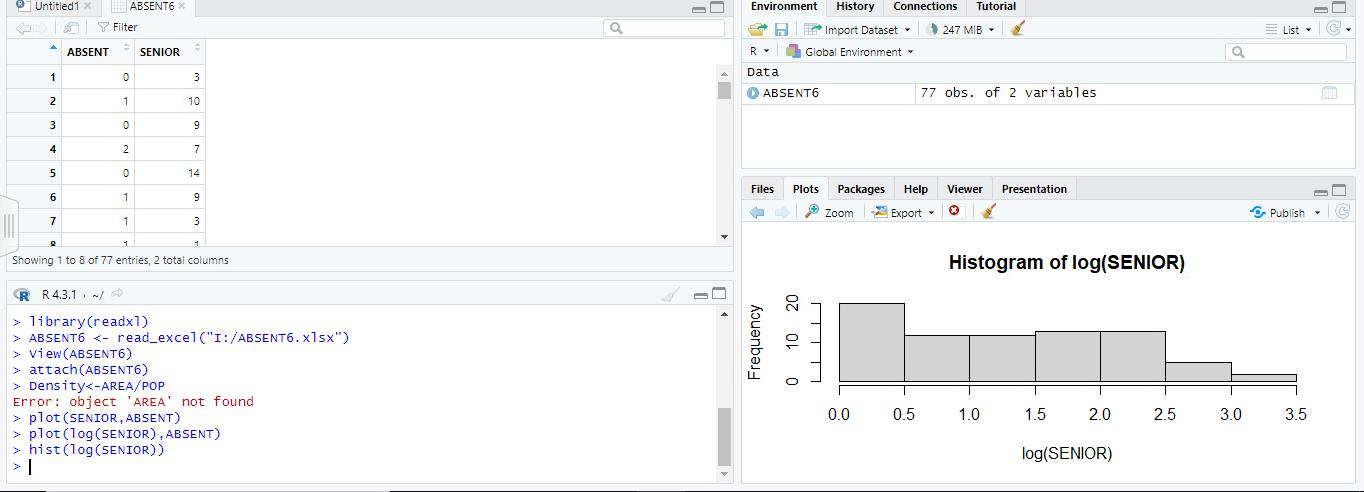
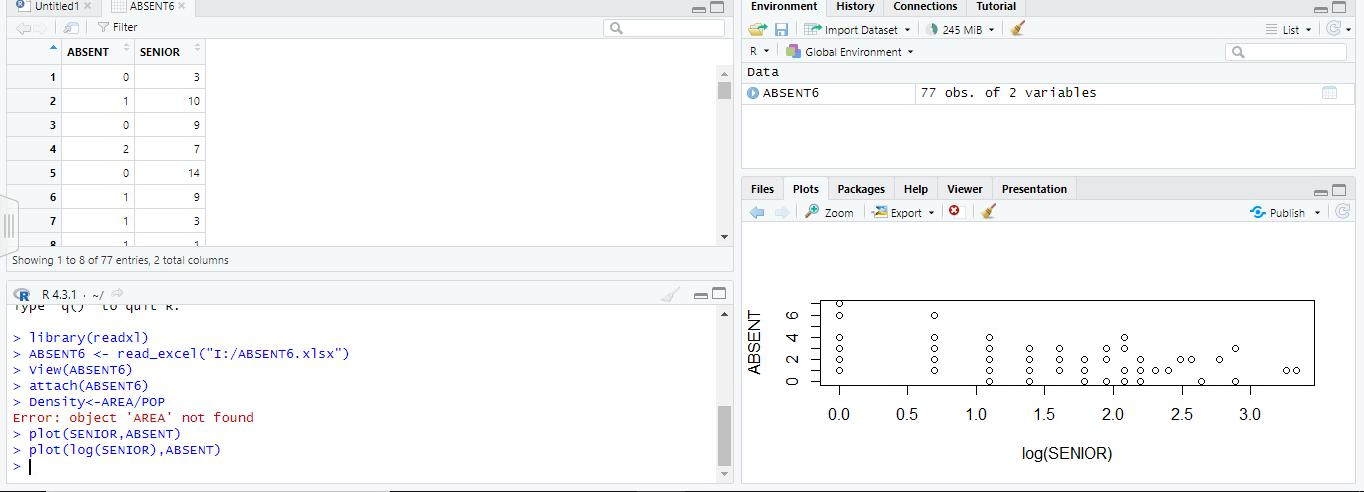
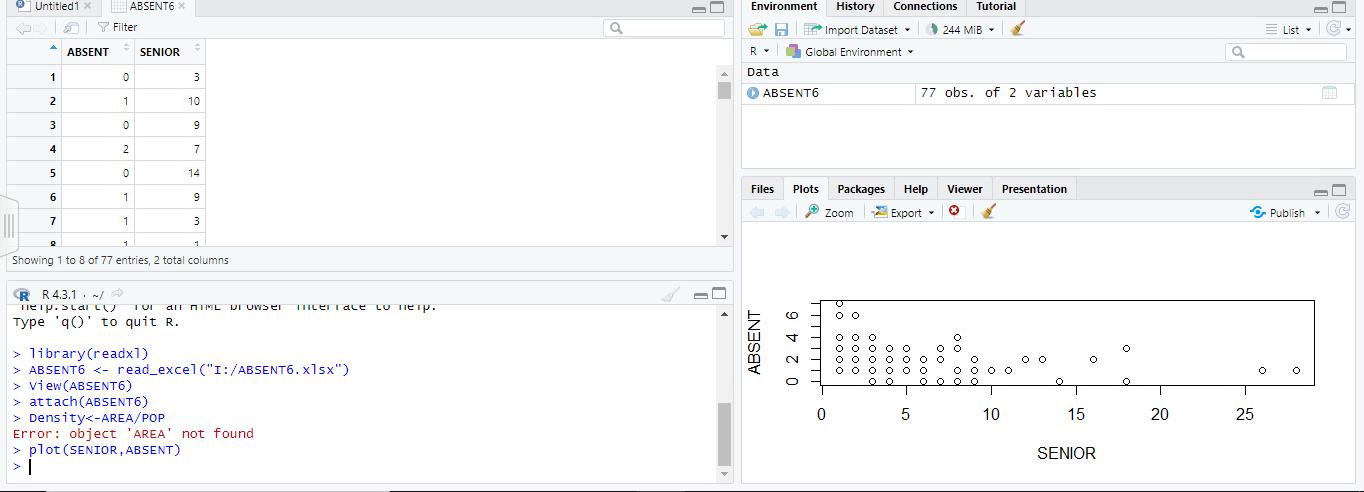
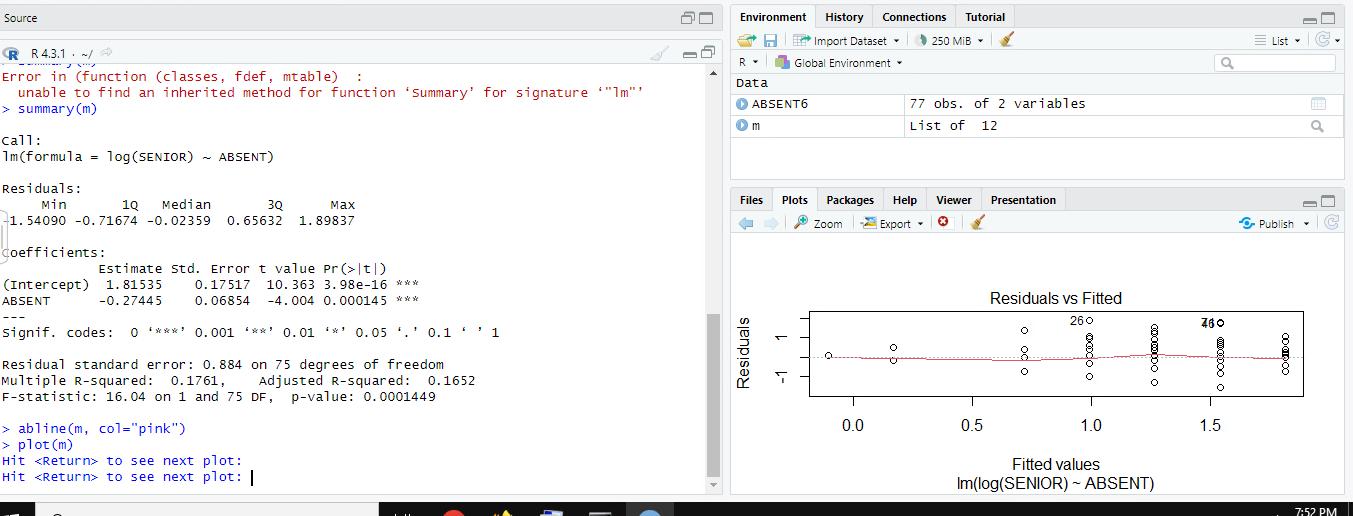
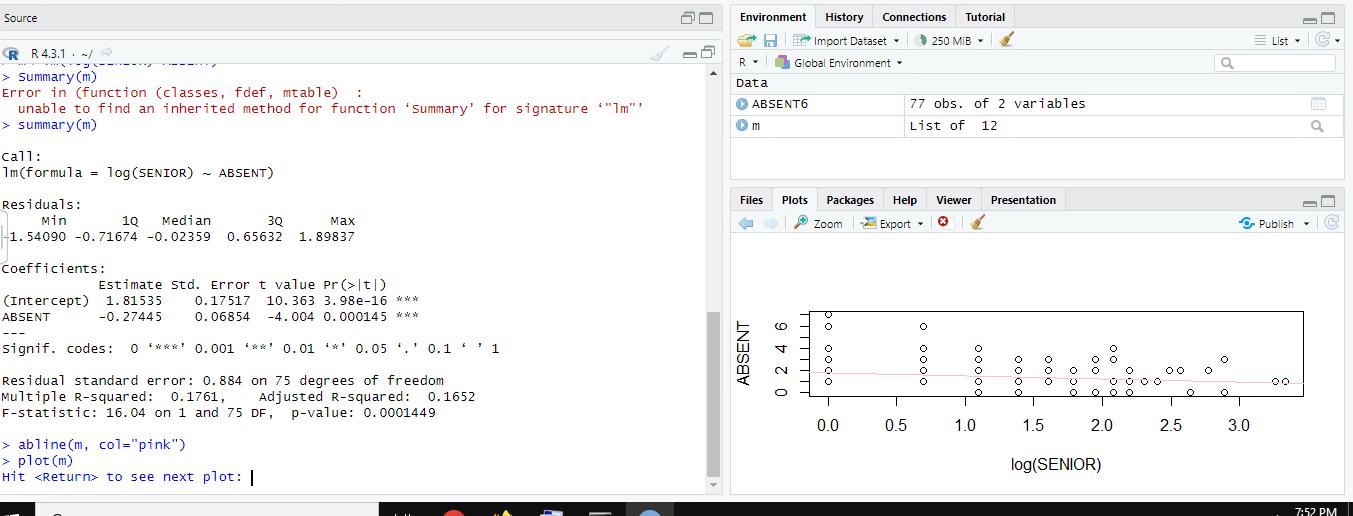
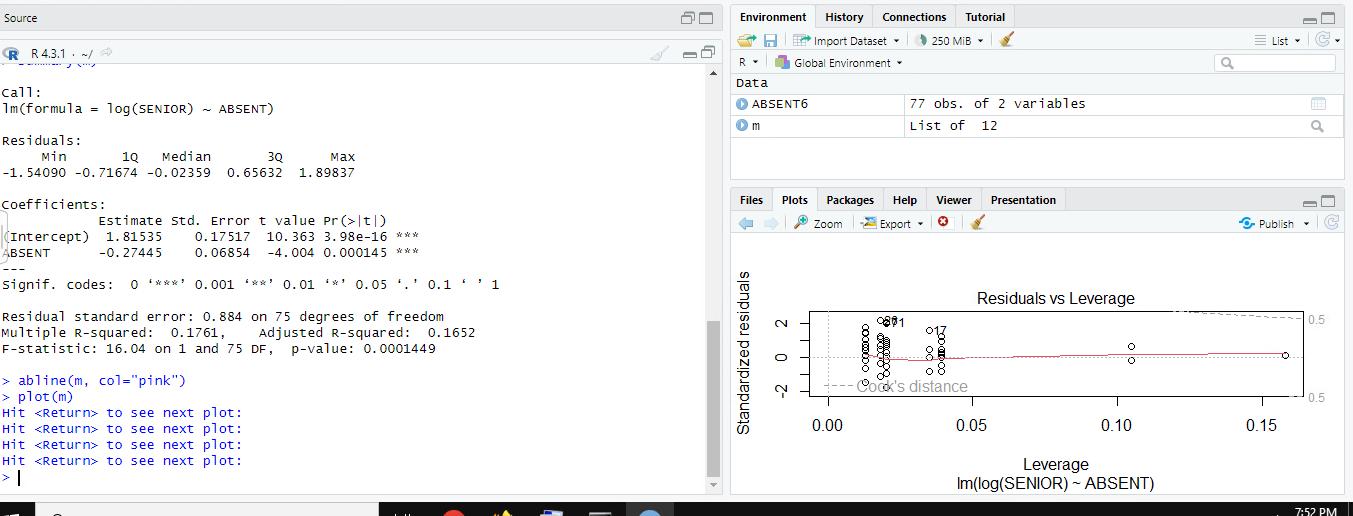
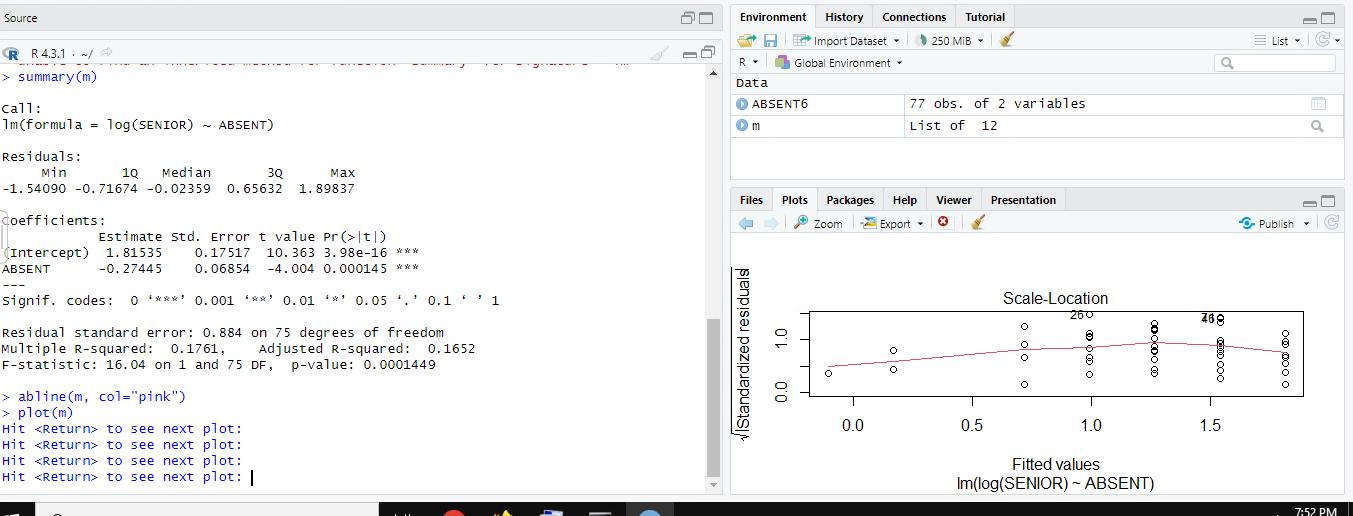
Untitled1 x ABSENT ABSENT6 * Filter SENIOR 1 0 3 2 1 10 3 0 9 4 2 7 5 0 14 6 1 9 7 1 3 2 1 Showing 1 to 8 of 77 entries, 2 total columns RR 4.3.1 / 4 > library(readx1) > ABSENT View (ABSENT6) > attach(ABSENT6) > Density plot (SENIOR, ABSENT) not found > plot (log(SENIOR), ABSENT) >hist (log(SENIOR)) > I Environment History Connections a Import Dataset R Data Global Environment ABSENT6 Files Plots Zoom Frequency 10 20 0 Tutorial 247 MiB 77 obs. of 2 variables Packages Help Viewer Presentation Export Histogram of log(SENIOR) 0.0 0.5 1.0 10 1.5 2.0 log(SENIOR) 25 2.5 3.0 List a Publish 35 3.5
Step by Step Solution
There are 3 Steps involved in it
Step: 1

Get Instant Access to Expert-Tailored Solutions
See step-by-step solutions with expert insights and AI powered tools for academic success
Step: 2

Step: 3

Ace Your Homework with AI
Get the answers you need in no time with our AI-driven, step-by-step assistance
Get Started


