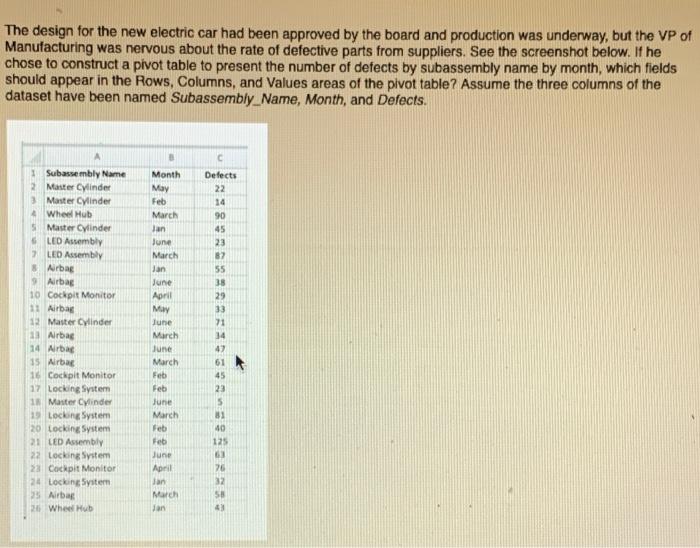
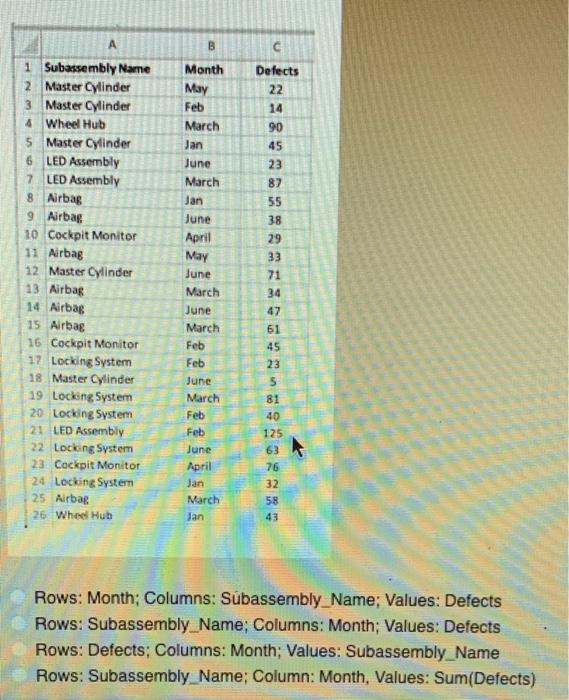
The design for the new electric car had been approved by the board and production was underway, but the VP of Manufacturing was nervous about the rate of defective parts from suppliers. See the screenshot below. If he chose to construct a pivot table to present the number of defects by subassembly name by month, which fields should appear in the Rows, Columns, and Values areas of the pivot table? Assume the three columns of the dataset have been named Subassembly_Name, Month, and Defects. Subassembly Name 2 Master Cylinder 3 Master Cylinder Wheel Hub 5 Master Cylinder LED Assembly 7 LED Assembly Airbag 9 Airbag 10 Cockpit Monitor 11 Airbag 12 Master Cylinder 13 Airbag 14 Airbag 15 Arba 16 Cockpit Monitor 17 Locking System 10 Master Cylinder 1 Locking System 20 Locking System 21 LED Assembly 22 Locking System 23 Cockpit Monitor 24 Locking System 3 Airbag 2 Wheel Hub Month May Feb March Jan June March Jan June April May June March June March Feb Feb June March Feb Feb June April Jan March Jan c Defects 22 14 90 45 23 82 55 38 29 33 71 34 42 61 45 23 5 81 40 125 63 26 32 SB 4 A B C Month Defects 22 May 14 1 Subassembly Name 2 Master Cylinder 3 Master Cylinder 4 Wheel Hub 5 Master Cylinder 6 LED Assembly 7 LED Assembly 8 Airbag 9 Airbag 10 Cockpit Monitor 11 Airbag 12 Master Cylinder 13 Airbag 14 Airbag 15 Airbag 16 Cockpit Monitor 17 Locking System 18 Master Cylinder 19 Locking System 20 Locking System 21 LED Assembly 22 Locking System 23 Cockpit Monitor 24 Locking System 25 Airbag 26 Wheel Hub 90 45 23 87 55 38 29 33 71 34 Feb March Jan June March Jan June April May June March June March Feb Feb June March Feb Feb June April Jan March Jan 42 61 45 23 5 81 40 125 63 76 32 58 43 Rows: Month; Columns: Subassembly_Name; Values: Defects Rows: Subassembly Name: Columns: Month; Values: Defects Rows: Defects: Columns: Month; Values: Subassembly Name Rows: Subassembly_Name: Column: Month, Values: Sum(Defects)