

Answered step by step
Verified Expert Solution
Question
1 Approved Answer
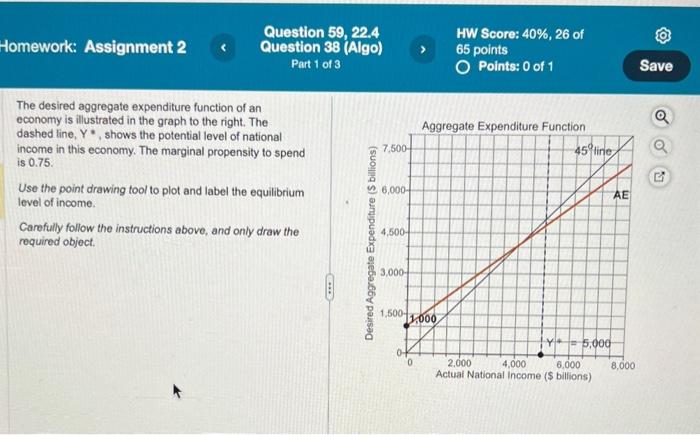
The desired aggregate expenditure function of an economy is illustrated in the graph to the right. The dashed line, Y * shows the potential level
Step by Step Solution
There are 3 Steps involved in it
Step: 1

Get Instant Access to Expert-Tailored Solutions
See step-by-step solutions with expert insights and AI powered tools for academic success
Step: 2

Step: 3
Ace Your Homework with AI
Get the answers you need in no time with our AI-driven, step-by-step assistance
Get Started
Fundamentals Of Multinational Finance
Authors: Michael H. Moffett, Arthur I. Stonehill, David K. Eiteman
1st Edition
0201844842, 978-0201844849