

Answered step by step
Verified Expert Solution
Question
1 Approved Answer
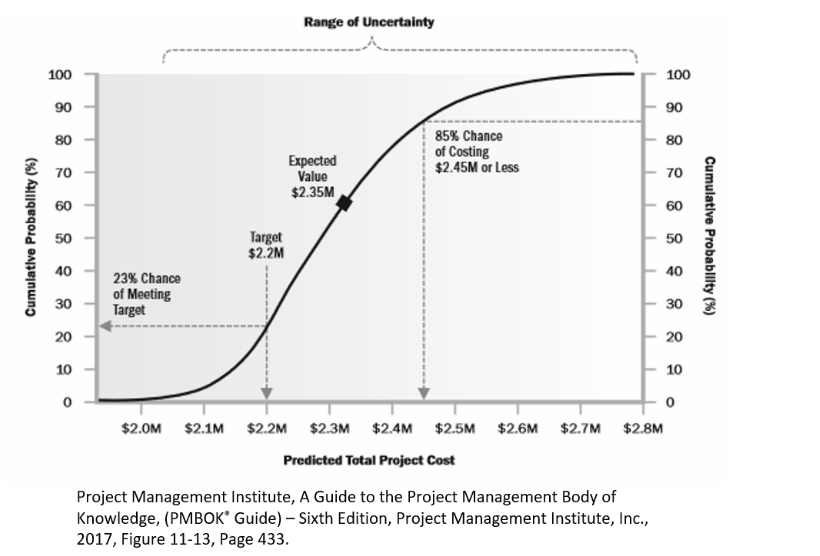
The Diagram below shows the probability (Vertical axis) of completing a project at a cost not exceeding the cost shown on the horizontal axis. What
- The Diagram below shows the probability (Vertical axis) of completing a project at a cost not exceeding the cost shown on the horizontal axis. What is the probability (rougly) of completeing the project at a cost not exceeding not exceeding $2.4 million?
Step by Step Solution
There are 3 Steps involved in it
Step: 1

Get Instant Access to Expert-Tailored Solutions
See step-by-step solutions with expert insights and AI powered tools for academic success
Step: 2

Step: 3
Ace Your Homework with AI
Get the answers you need in no time with our AI-driven, step-by-step assistance
Get Started
The Power Of Laws
Authors: Terence K Moloisane
1st Edition
B08Z7HTFTJ, B0CP2YDQDK