

Answered step by step
Verified Expert Solution
Question
1 Approved Answer
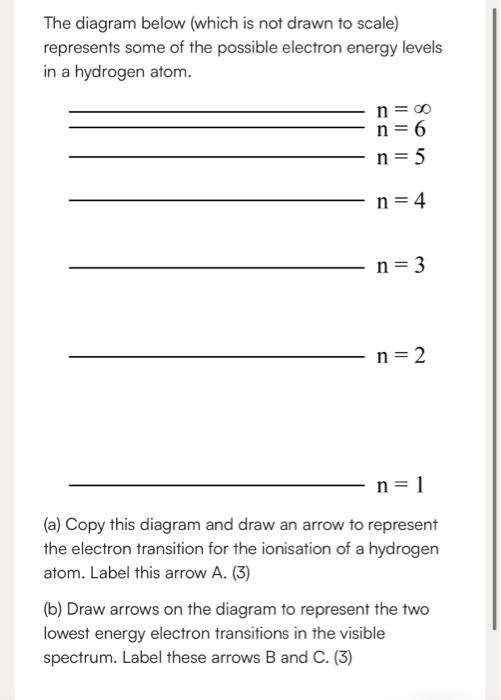
The diagram below (which is not drawn to scale) represents some of the possible electron energy levels in a hydrogen atom. n= n=6 n=5 n=4
Step by Step Solution
There are 3 Steps involved in it
Step: 1

Get Instant Access to Expert-Tailored Solutions
See step-by-step solutions with expert insights and AI powered tools for academic success
Step: 2

Step: 3
Ace Your Homework with AI
Get the answers you need in no time with our AI-driven, step-by-step assistance
Get Started
Modern Chemistry
Authors: RINEHART AND WINSTON HOLT
Student Edition 2007
9780030922046, 0030922046