Answered step by step
Verified Expert Solution
Question
1 Approved Answer
The efficient limit curve shows the relationship between Select one: a. The total risk of each security and the required return b. Systematic risks for
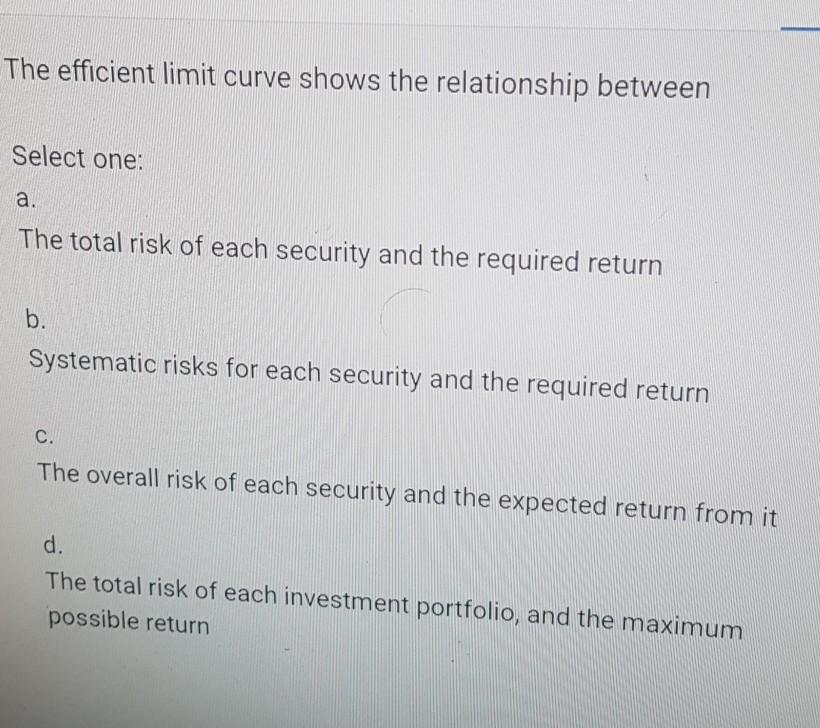
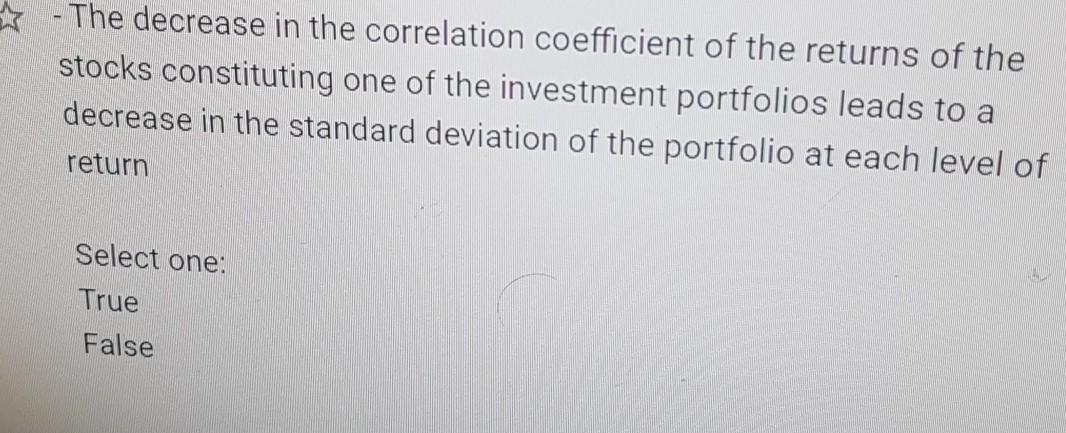


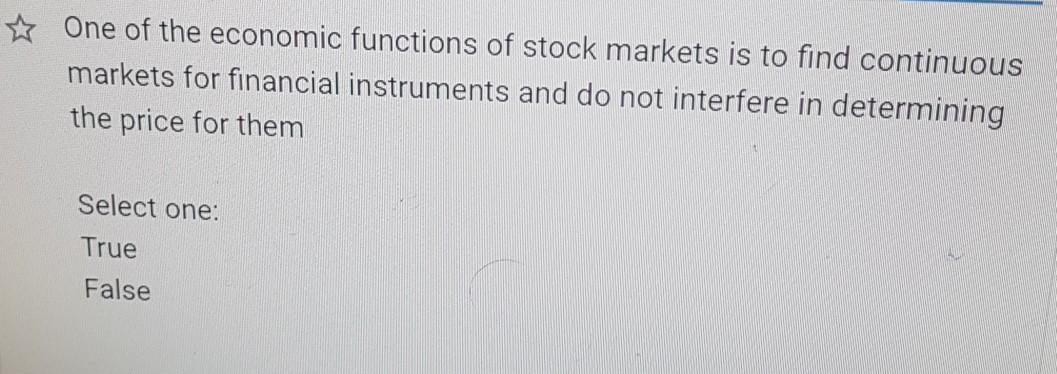
The efficient limit curve shows the relationship between Select one: a. The total risk of each security and the required return b. Systematic risks for each security and the required return C. The overall risk of each security and the expected return from it d. The total risk of each investment portfolio, and the maximum possible return * -The decrease in the correlation coefficient of the returns of the stocks constituting one of the investment portfolios leads to a decrease in the standard deviation of the portfolio at each level of return Select one: True False If the annual dividends for one of the shares at the end of the year are equal to 10 dollars, and these dividends grow by 5% annually, then the expected profits during the next year are equal to Select one: a. 10.5 dollars b. None of the above C. 0.5 dollars d. 1.5 dollars The most important investment tools available to the investor in the international market are real estate, commodities, economic projects, minerals and foreign currencies only Select one: True False One of the economic functions of stock markets is to find continuous markets for financial instruments and do not interfere in determining the price for them Select one: True False
Step by Step Solution
There are 3 Steps involved in it
Step: 1

Get Instant Access to Expert-Tailored Solutions
See step-by-step solutions with expert insights and AI powered tools for academic success
Step: 2

Step: 3

Ace Your Homework with AI
Get the answers you need in no time with our AI-driven, step-by-step assistance
Get Started


