Answered step by step
Verified Expert Solution
Question
1 Approved Answer
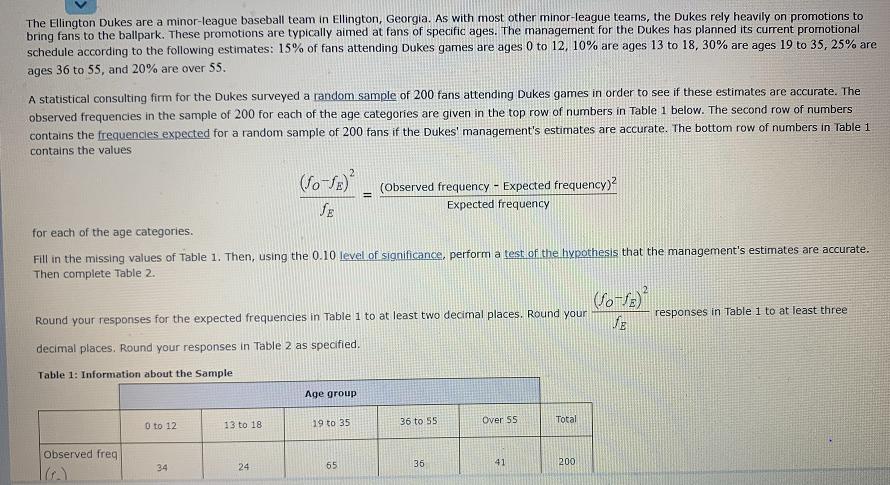
The Ellington Dukes are a minor-league baseball team in Ellington, Georgia. As with most other minor-league teams, the Dukes rely heavily on promotions to


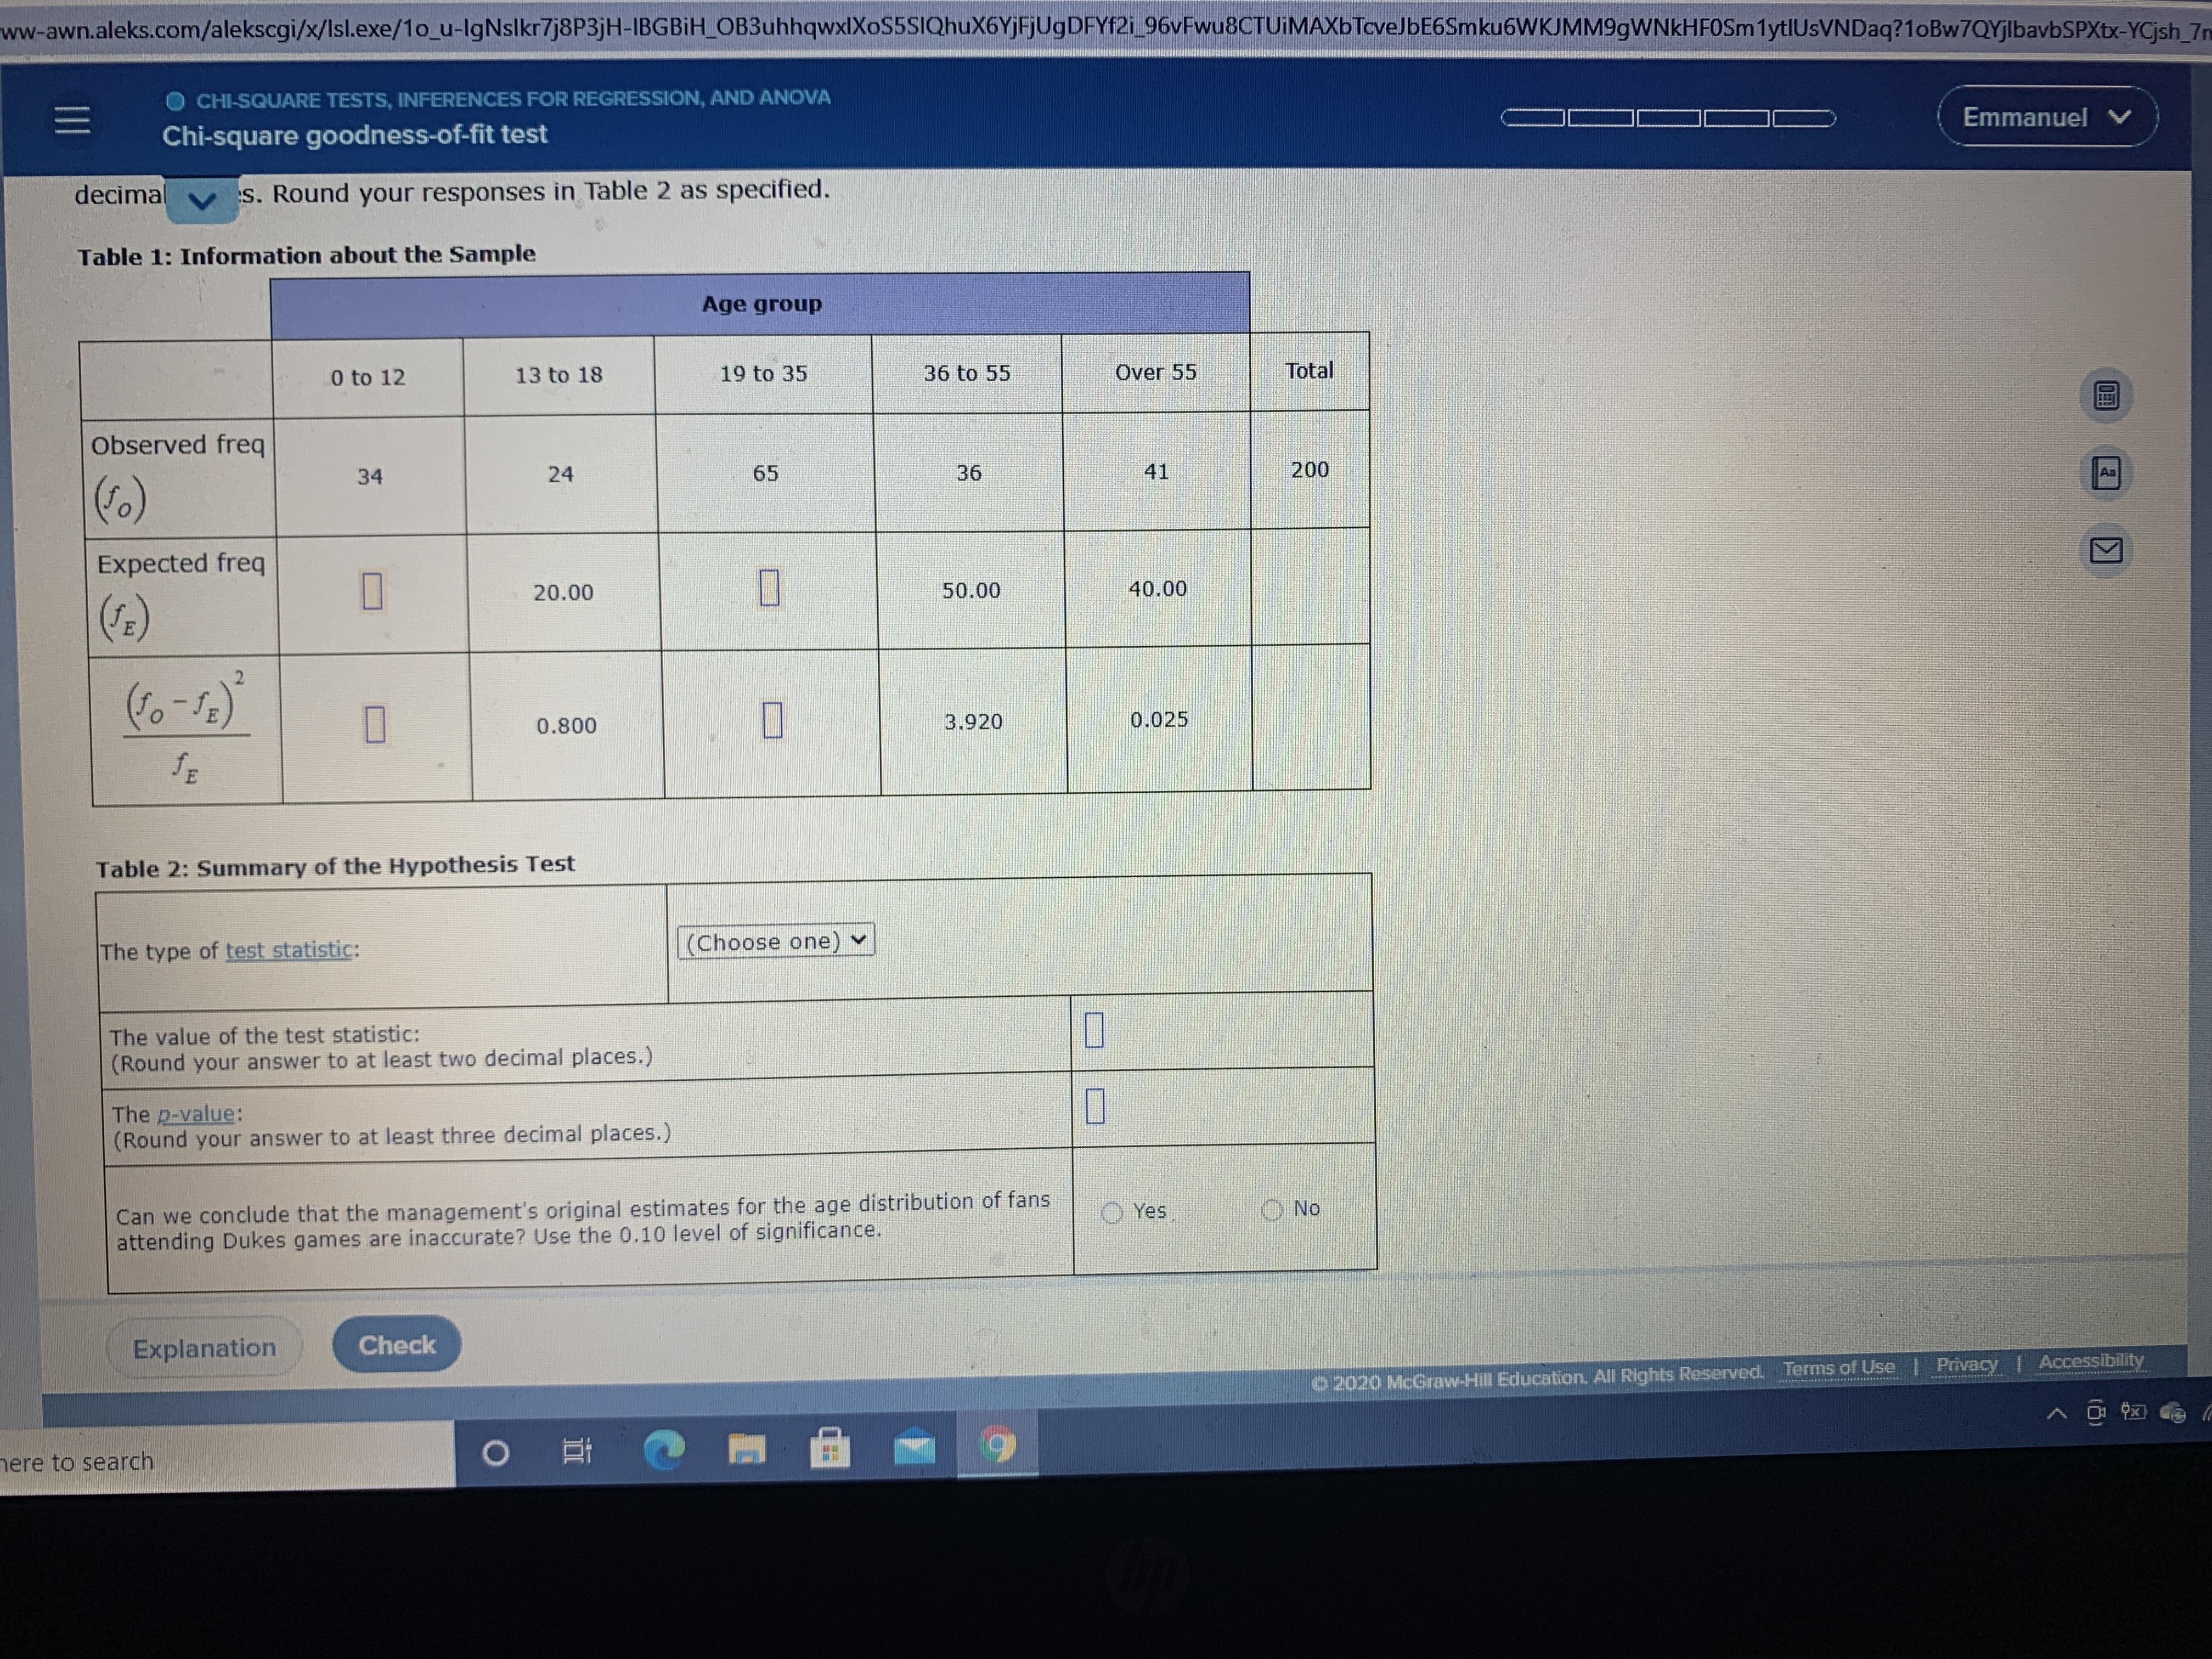
The Ellington Dukes are a minor-league baseball team in Ellington, Georgia. As with most other minor-league teams, the Dukes rely heavily on promotions to bring fans to the ballpark. These promotions are typically aimed at fans of specific ages. The management for the Dukes has planned its current promotional schedule according to the following estimates: 15% of fans attending Dukes games are ages 0 to 12, 10% are ages 13 to 18, 30% are ages 19 to 35, 25% are ages 36 to 55, and 20% are over 55. A statistical consulting firm for the Dukes surveyed a random sample of 200 fans attending Dukes games in order to see if these estimates are accurate. The observed frequencies in the sample of 200 for each of the age categories are given in the top row of numbers in Table 1 below. The second row of numbers contains the frequencies expected for a random sample of 200 fans if the Dukes' management's estimates are accurate. The bottom row of numbers in Table 1 contains the values (Observed frequency - Expected frequency)? Expected frequency fE for each of the age categories. Fill in the missing values of Table 1. Then, using the 0.10 level of significance, perform a test of the hypothesis that the management's estimates are accurate. Then complete Table 2. responses in Table 1 to at least three Round your responses for the expected frequencies in Table 1 to at least two decimal places. Round your decimal places. Round your responses in Table 2 as specified. Table 1: Information about the Sample Age group 19 to 35 36 to 55 Over S5 Total O to 12 13 to 18 Observed freg 34 24 65 36 41 200 (r.) ww-awn.aleks.com/alekscgi/x/Isl.exe/1o_u-lgNslkr7j8P3jH-IBGBIH_OB3uhhqwxlXoS5SIQhuX6YjFjUgDFYf2i_96vFwu8CTUIMAXbTcveJbE6Smku6WKJMM9gWNkHFOSm1ytlUsVNDaq?1oBw7QYjlbavbSPXtx-YCjsh_7n CHI-SQUARE TESTS, INFERENCES FOR REGRESSION, AND ANOVA Emmanuel V Chi-square goodness-of-fit test decimal s. Round your responses in Table 2 as specified. Table 1: Information about the Sample Age group 0 to 12 13 to 18 19 to 35 36 to 55 Over 55 Total Observed freq 34 24 65 36 41 200 Aa Expected freq 20.00 50.00 40.00 0.800 3.920 0.025 Table 2: Summary of the Hypothesis Test The type of test statistic: (Choose one) The value of the test statistic: (Round your answer to at least two decimal places.) The p-value: (Round your answer to at least three decimal places.) Can we conclude that the management's original estimates for the age distribution of fans attending Dukes games are inaccurate? Use the 0.10 level of significance. O Yes No Explanation Check 2020 McGraw-Hill Education. All Rights Reserved. Terms of Use | Privacy Accessibility nere to search
Step by Step Solution
★★★★★
3.48 Rating (161 Votes )
There are 3 Steps involved in it
Step: 1

Get Instant Access to Expert-Tailored Solutions
See step-by-step solutions with expert insights and AI powered tools for academic success
Step: 2

Step: 3

Ace Your Homework with AI
Get the answers you need in no time with our AI-driven, step-by-step assistance
Get Started


