

Answered step by step
Verified Expert Solution
Question
1 Approved Answer
The estimated distribution (in millions) of the population by age in a certain country for the year 2015 is shown in the pie chart. Make
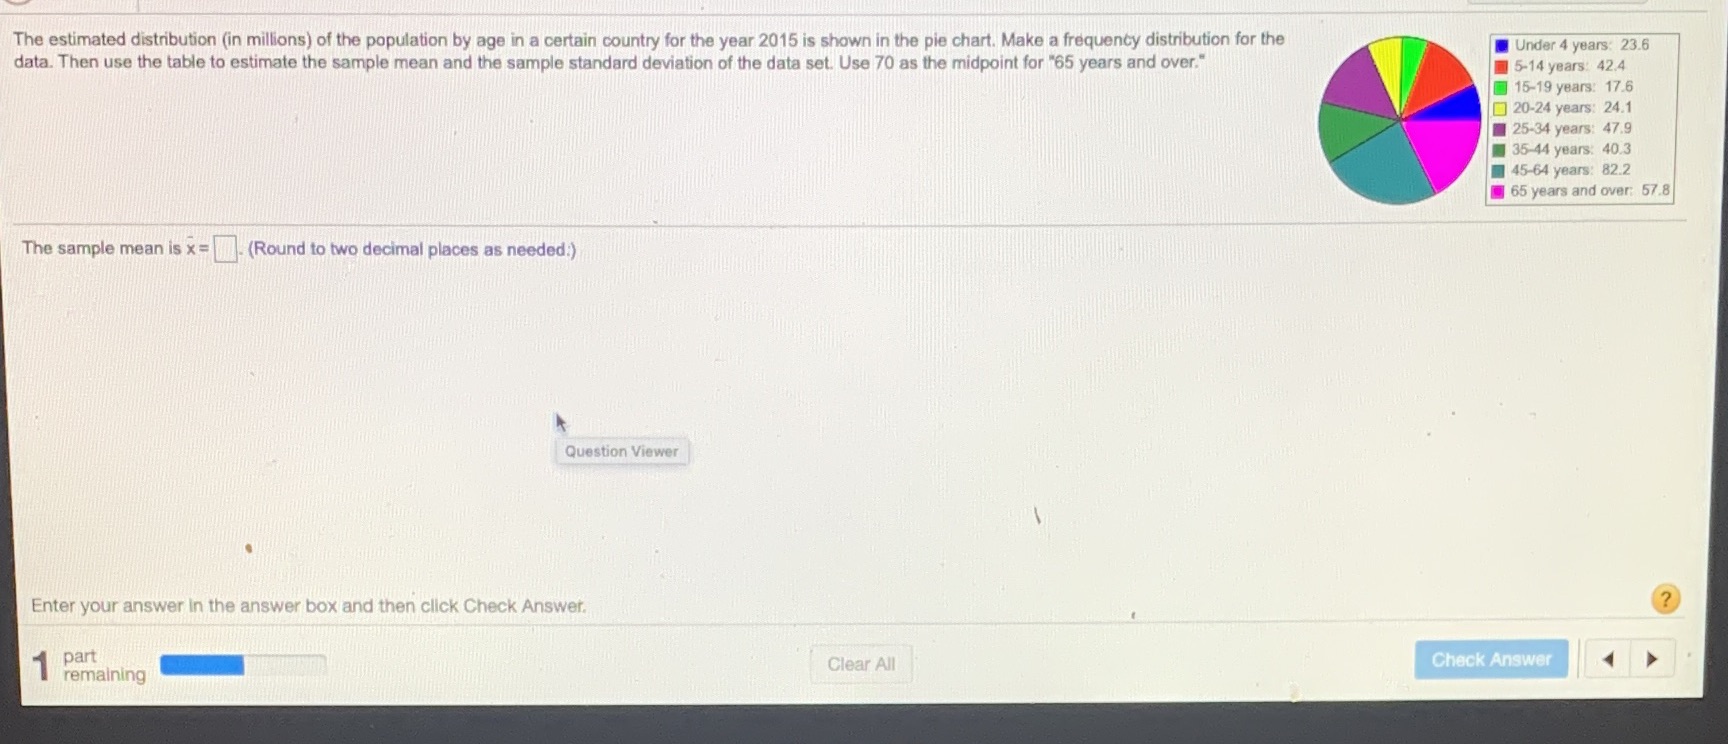 The estimated distribution (in millions) of the population by age in a certain country for the year 2015 is shown in the pie chart. Make a frequency distribution for the Under 4 years: 23.6 data. Then use the table to estimate the sample mean and the sample standard deviation of the data set. Use 70 as the midpoint for "65 years and over." 15-14 years: 42.4 1 15-19 years: 17.6 20-24 years: 24.1 25-34 years: 47.9 35-44 years: 40.3 45-64 years: 82.2 65 years and over: 57.8 The sample mean is x= (Round to two decimal places as needed!) Question Viewer Enter your answer in the answer box and then click Check Answer. ? part remaining Clear All Check
Step by Step Solution
There are 3 Steps involved in it
Step: 1

Get Instant Access to Expert-Tailored Solutions
See step-by-step solutions with expert insights and AI powered tools for academic success
Step: 2

Step: 3
Ace Your Homework with AI
Get the answers you need in no time with our AI-driven, step-by-step assistance
Get Started