Answered step by step
Verified Expert Solution
Question
1 Approved Answer
The example of retail sales regressed on disposable income-Figure 11.4has a scat- ter plot that follows the pattern assumed in regression analysis. That pattern, however,

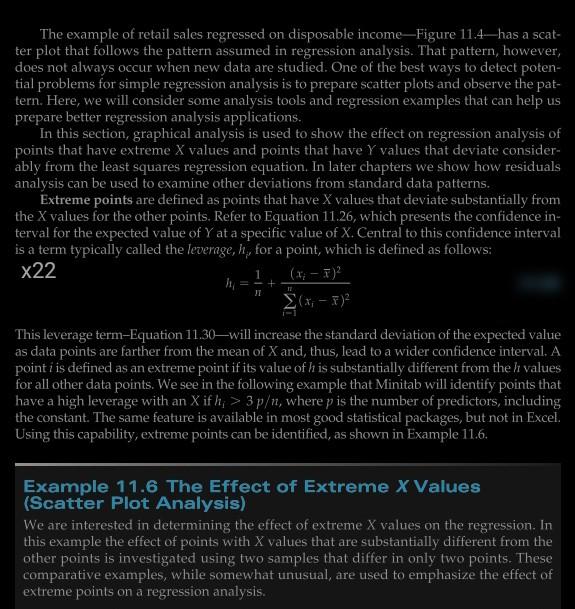
The example of retail sales regressed on disposable income-Figure 11.4has a scat- ter plot that follows the pattern assumed in regression analysis. That pattern, however, does not always occur when new data are studied. One of the best ways to detect poten- tial problems for simple regression analysis is to prepare scatter plots and observe the pat- tern. Here, we will consider some analysis tools and regression examples that can help us prepare better regression analysis applications. In this section, graphical analysis is used to show the effect on regression analysis of points that have extreme X values and points that have Y values that deviate consider- ably from the least squares regression equation. In later chapters we show how residuals analysis can be used to examine other deviations from standard data patterns. Extreme points are defined as points that have X values that deviate substantially from the X values for the other points. Refer to Equation 11.26, which presents the confidence in- terval for the expected value of Y at a specific value of X. Central to this confidence interval is a term typically called the leverage, h, for a point, which is defined as follows: x22 (x - 1)? (x; - 2 This leverage term-Equation 11.30will increase the standard deviation of the expected value as data points are farther from the mean of Xand, thus, lead to a wider confidence interval, A point i is defined as an extreme point if its value of his substantially different from the h values for all other data points. We see in the following example that Minitab will identify points that have a high leverage with an X ifh; > 3p, where p is the number of predictors, including the constant. The same feature is available in most good statistical packages, but not in Excel. Using this capability, extreme points can be identified, as shown in Example 11.6. + Example 11.6 The Effect of Extreme X Values (Scatter Plot Analysis) We are interested in determining the effect of extreme X values on the regression. In this example the effect of points with X values that are substantially different from the other points is investigated using two samples that differ in only two points. These comparative examples, while somewhat unusual, are used to emphasize the effect of extreme points on a regression analysis
Step by Step Solution
There are 3 Steps involved in it
Step: 1

Get Instant Access to Expert-Tailored Solutions
See step-by-step solutions with expert insights and AI powered tools for academic success
Step: 2

Step: 3

Ace Your Homework with AI
Get the answers you need in no time with our AI-driven, step-by-step assistance
Get Started


