Answered step by step
Verified Expert Solution
Question
1 Approved Answer
The Excel file BankMarketing contains the following data as predictors: 1) age of a client 2) job type (categorical variable) 3) marital status (categorical variable)

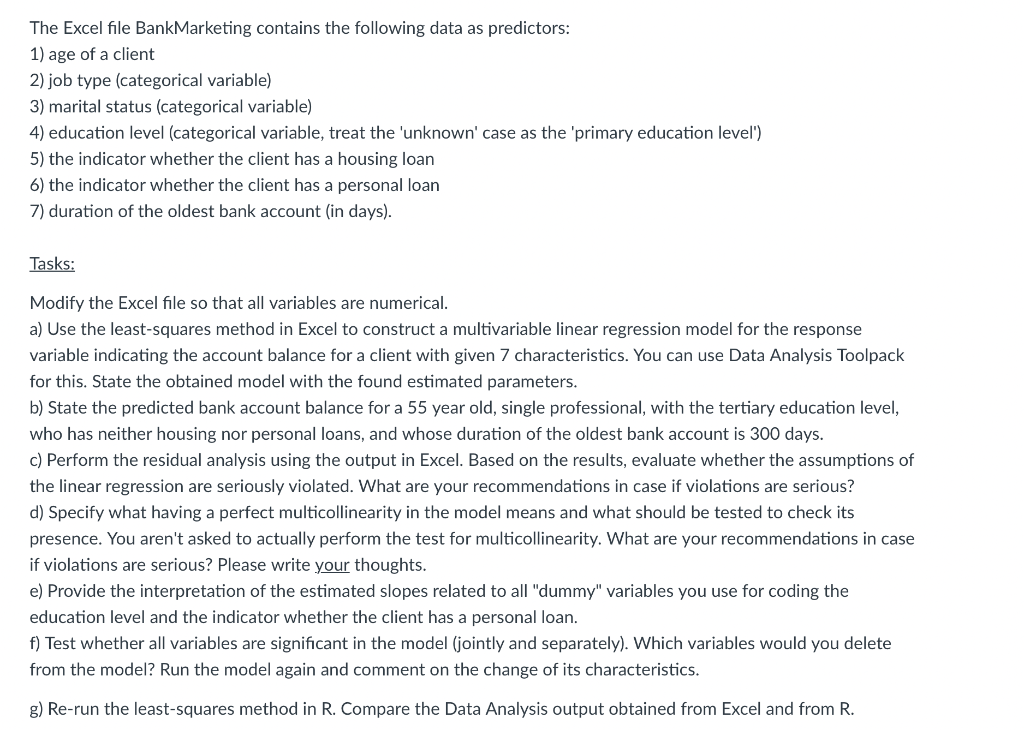
The Excel file BankMarketing contains the following data as predictors: 1) age of a client 2) job type (categorical variable) 3) marital status (categorical variable) 4) education level (categorical variable, treat the 'unknown' case as the 'primary education level') 5) the indicator whether the client has a housing loan 6) the indicator whether the client has a personal loan 7) duration of the oldest bank account (in days). Tasks: Modify the Excel file so that all variables are numerical. a) Use the least-squares method in Excel to construct a multivariable linear regression model for the response variable indicating the account balance for a client with given 7 characteristics. You can use Data Analysis Toolpack for this. State the obtained model with the found estimated parameters. b) State the predicted bank account balance for a 55 year old, single professional, with the tertiary education level, who has neither housing nor personal loans, and whose duration of the oldest bank account is 300 days. c) Perform the residual analysis using the output in Excel. Based on the results, evaluate whether the assumptions of the linear regression are seriously violated. What are your recommendations in case if violations are serious? d) Specify what having a perfect multicollinearity in the model means and what should be tested to check its presence. You aren't asked to actually perform the test for multicollinearity. What are your recommendations in case if violations are serious? Please write your thoughts. e) Provide the interpretation of the estimated slopes related to all "dummy" variables you use for coding the education level and the indicator whether the client has a personal loan. f) Test whether all variables are significant in the model (jointly and separately). Which variables would you delete from the model? Run the model again and comment on the change of its characteristics. g) Re-run the least-squares method in R. Compare the Data Analysis output obtained from Excel and from R. The Excel file BankMarketing contains the following data as predictors: 1) age of a client 2) job type (categorical variable) 3) marital status (categorical variable) 4) education level (categorical variable, treat the 'unknown' case as the 'primary education level') 5) the indicator whether the client has a housing loan 6) the indicator whether the client has a personal loan 7) duration of the oldest bank account (in days). Tasks: Modify the Excel file so that all variables are numerical. a) Use the least-squares method in Excel to construct a multivariable linear regression model for the response variable indicating the account balance for a client with given 7 characteristics. You can use Data Analysis Toolpack for this. State the obtained model with the found estimated parameters. b) State the predicted bank account balance for a 55 year old, single professional, with the tertiary education level, who has neither housing nor personal loans, and whose duration of the oldest bank account is 300 days. c) Perform the residual analysis using the output in Excel. Based on the results, evaluate whether the assumptions of the linear regression are seriously violated. What are your recommendations in case if violations are serious? d) Specify what having a perfect multicollinearity in the model means and what should be tested to check its presence. You aren't asked to actually perform the test for multicollinearity. What are your recommendations in case if violations are serious? Please write your thoughts. e) Provide the interpretation of the estimated slopes related to all "dummy" variables you use for coding the education level and the indicator whether the client has a personal loan. f) Test whether all variables are significant in the model (jointly and separately). Which variables would you delete from the model? Run the model again and comment on the change of its characteristics. g) Re-run the least-squares method in R. Compare the Data Analysis output obtained from Excel and from R
Step by Step Solution
There are 3 Steps involved in it
Step: 1

Get Instant Access to Expert-Tailored Solutions
See step-by-step solutions with expert insights and AI powered tools for academic success
Step: 2

Step: 3

Ace Your Homework with AI
Get the answers you need in no time with our AI-driven, step-by-step assistance
Get Started


