

Question
the excel file expenditure shows the spending of a country on various sports during a particular year. Create a pie chart and determine the percentage
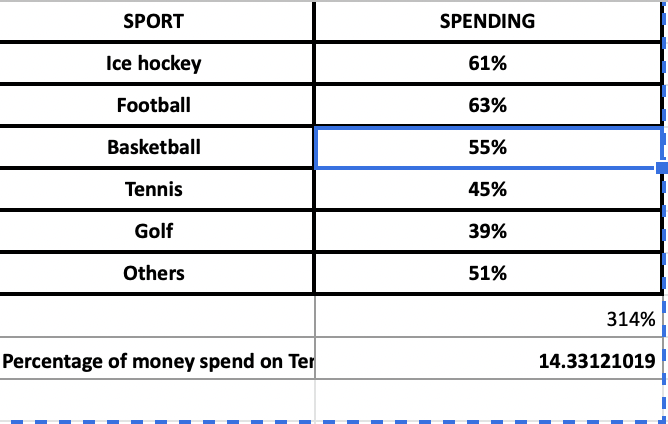
the excel file expenditure shows the spending of a country on various sports during a particular year. Create a pie chart and determine the percentage of total spending on tennis. Please show the formulas on excel sheet step by step.
\begin{tabular}{|c|c|} \hline SPORT & \multicolumn{2}{|c|}{ SPENDING } \\ \hline Ice hockey & 61% \\ \hline Football & 63% \\ \hline Basketball & 55% \\ \hline Tennis & 45% \\ \hline Golf & 39% \\ \hline Others & 51% \\ \hline Percentage of money spend on Ter & \multicolumn{2}{|c|}{14.33121019} \\ \hline \end{tabular}Step by Step Solution
There are 3 Steps involved in it
Step: 1

Get Instant Access to Expert-Tailored Solutions
See step-by-step solutions with expert insights and AI powered tools for academic success
Step: 2

Step: 3
Ace Your Homework with AI
Get the answers you need in no time with our AI-driven, step-by-step assistance
Get Started
Spatio Temporal Database Management International Workshop Stdbm 99 Edinburgh Scotland September 10 11 1999 Proceedings Lncs 1678
Authors: Michael H. Bohlen ,Christian S. Jensen ,Michel O. Scholl
1999th Edition
3540664017, 978-3540664017