

Answered step by step
Verified Expert Solution
Question
1 Approved Answer
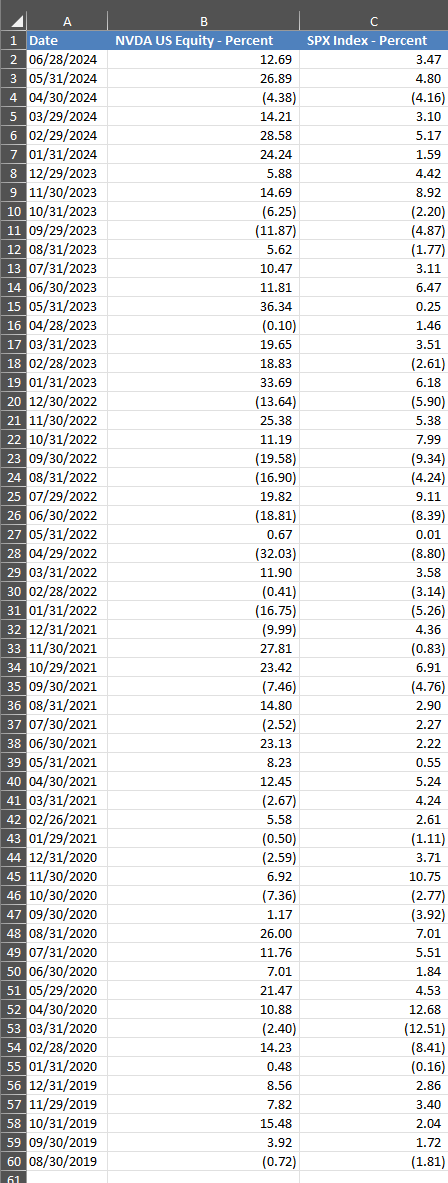
The excel file NVDA.xlsx Download NVDA.xlsxcontains the monthly returns for the common stock of Nvidia ( NVDA ) and S&P 5 0 0 Index (
The excel file NVDA.xlsx Download NVDA.xlsxcontains the monthly returns for the common stock of Nvidia NVDA and S&P Index SPX for a fiveyear period:
As a financial analyst you are testing whether the variation in the stock market returns can explain the variation the NVDA stock returns over this period of concern. In order to do so you decide to run a regression model to predict the stock returns of NVDA based on the market stock returns. Assume
Please run the regression analysis in Excel and uploadattach a picture of the Excel output for this question. Format the results in the tables to be user friendly.
Step by Step Solution
There are 3 Steps involved in it
Step: 1

Get Instant Access to Expert-Tailored Solutions
See step-by-step solutions with expert insights and AI powered tools for academic success
Step: 2

Step: 3
Ace Your Homework with AI
Get the answers you need in no time with our AI-driven, step-by-step assistance
Get Started
Survey of Accounting
Authors: Edmonds, old, Mcnair, Tsay
2nd edition
9780077392659, 978-0-07-73417, 77392655, 0-07-734177-5, 73379557, 978-0073379555