The Excel file Regression Data SP19.xlsx provides data on a randomly selected group of employees. When potential workers apply, they are given three different tests to measure their manual dexterity. The file lists their rating for combined speed and accuracy in performing manual assembly of small intricate parts and seniority (months with the company) at the time of the performance evaluation. The goal is to develop a regression model for predicting performance ratings.
- On the Regression Summary Output sheet, write Excel formulas to calculate the expected performance rating for a potential worker with a Test 3 score of 63, and to compute an approximate 68% prediction interval based on the empirical rule for your estimate. Do not use the TREND function. Format the results as a Number with 1 decimal.
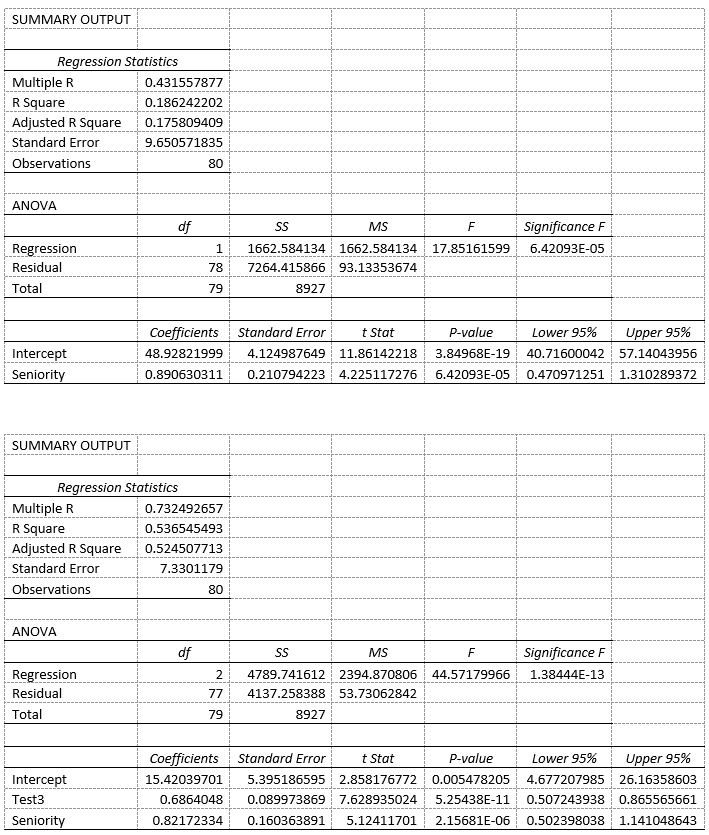
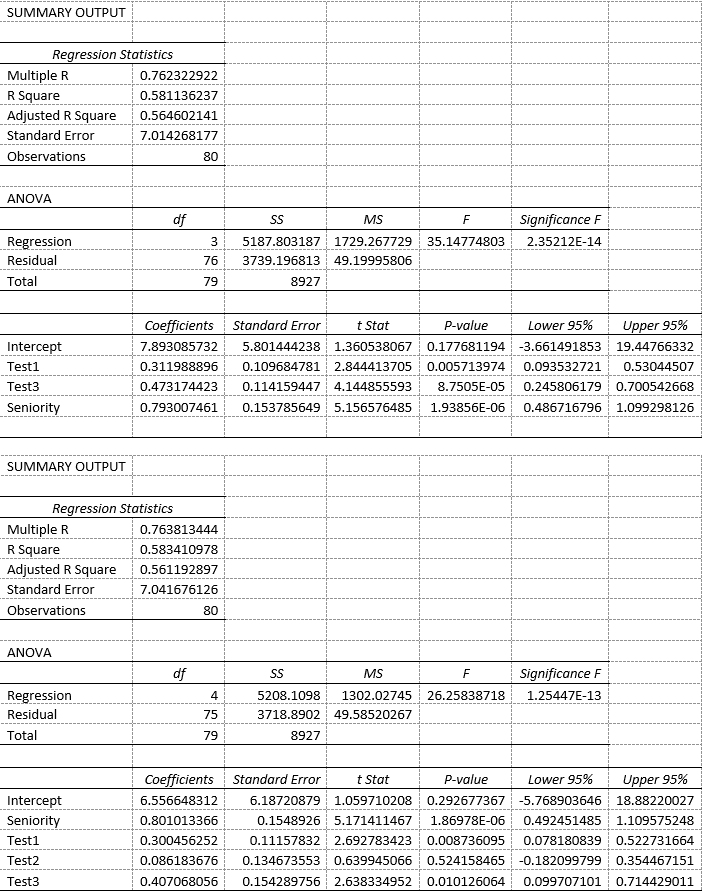
SUMMARY OUTPUT Rearession Statistics Multiple R R Square Adjusted R Square 0.175809409 Standard Error Observations 0.431557877 0.186242202 9.650571835 80 ANOVA Significance F 1 1662.584134 1662.584134 17.851615996.42093E-05 df MS Regression Residual Total 78 7264.415866 93.13353674 79 8927 | Lower 95% Upper 95% 48.928219994.124987649 11.861422183.84968E-19 40.71600042 57.14043956 0.890630311 0.2107942234.2251172766.42093E-050.470971251 1.310289372 Coefficients Standard Error t Stat P-value Intercept Senior SUMMARY OUTPUT Rearession Statistics Multiple FR R Square Adjusted R Square0.524507713 Standard Error Observations 0.732492657 0.536545493 7.3301179 80 ANOVA Significance F 2 4789.741612 2394.870806 44.57179966 1.38444E-13 MS Regression Residual Total 77 4137.258388 53.73062842 8927 79 Lower 95% Upper 95% 15.420397015.395186595 2.858176772 0.0054782054.677207985 26.16358603 0.6864048 0.089973869 7.628935024 5.25438E-110.5072439380.865565661 0.821723340.160363891 5,124117012,15681E-060.502398038 1.141048643 icients Standard Error t Stat P-value Intercept Test3 Senior SUMMARY OUTPUT Rearession Statistics Multiple R R Square Adjusted R Square 0.564602141 Standard Error Observations 0.762322922 0.581136237 7.014268177 80 ANOVA Significance F 3 5187.803187 1729.267729 35.147748032.35212E-14 MS Regression Residual Total 76 3739.196813 49.19995806 79 8927 Coefficients Standard Error 7.893085732 5.801444238 1.360538067 0.1776811943.661491853 19.44766332 0.311988896 0.109684781 2.844413705 0.0057139740.093532721 0.53044507 0.4731744230.1141594474.1448555938.7505E-05 0.2458061790.700542668 0.7930074610.153785649 5.156576485 1.93856E-06 0.4867167961.099298126 t Stat P-value Lower 95% ! Upper 95% Intercept Test1 Test3 Seniority SUMMARY OUTPUT Regression Stotistics Multiple R R Square Adjusted R Square 0.561192897 Standard Error Observations 0.763813444 0.583410978 7.041676126 80 ANOVA df MS Significance F Regression Residual Total 4 75 79 5208.1098 1302.02745 26.25838718 1.25447E-13 3718.8902 49.58520267 8927 Intercept Seniority Test1 Test2 Test3 cients i standard Error \ t Stat : P-value Lower 95% \ Upper 95% 6.556648312 6.187208791.0597102080.292677367-5.768903646 18.88220027 0.1548926 5.1714114671.86978E-06 0.492451485 1.109575248 0.300456252 0.111578322.6927834230.008736095 0.078180839 0.522731664 0.0861836760.134673553 0.639945066 0.5241584650.182099799 0.354467151 0.4070680560.154289756 2.638334952 0.010126064 0.099707101 0.714429011 0.801013366 SUMMARY OUTPUT Rearession Statistics Multiple R R Square Adjusted R Square 0.175809409 Standard Error Observations 0.431557877 0.186242202 9.650571835 80 ANOVA Significance F 1 1662.584134 1662.584134 17.851615996.42093E-05 df MS Regression Residual Total 78 7264.415866 93.13353674 79 8927 | Lower 95% Upper 95% 48.928219994.124987649 11.861422183.84968E-19 40.71600042 57.14043956 0.890630311 0.2107942234.2251172766.42093E-050.470971251 1.310289372 Coefficients Standard Error t Stat P-value Intercept Senior SUMMARY OUTPUT Rearession Statistics Multiple FR R Square Adjusted R Square0.524507713 Standard Error Observations 0.732492657 0.536545493 7.3301179 80 ANOVA Significance F 2 4789.741612 2394.870806 44.57179966 1.38444E-13 MS Regression Residual Total 77 4137.258388 53.73062842 8927 79 Lower 95% Upper 95% 15.420397015.395186595 2.858176772 0.0054782054.677207985 26.16358603 0.6864048 0.089973869 7.628935024 5.25438E-110.5072439380.865565661 0.821723340.160363891 5,124117012,15681E-060.502398038 1.141048643 icients Standard Error t Stat P-value Intercept Test3 Senior SUMMARY OUTPUT Rearession Statistics Multiple R R Square Adjusted R Square 0.564602141 Standard Error Observations 0.762322922 0.581136237 7.014268177 80 ANOVA Significance F 3 5187.803187 1729.267729 35.147748032.35212E-14 MS Regression Residual Total 76 3739.196813 49.19995806 79 8927 Coefficients Standard Error 7.893085732 5.801444238 1.360538067 0.1776811943.661491853 19.44766332 0.311988896 0.109684781 2.844413705 0.0057139740.093532721 0.53044507 0.4731744230.1141594474.1448555938.7505E-05 0.2458061790.700542668 0.7930074610.153785649 5.156576485 1.93856E-06 0.4867167961.099298126 t Stat P-value Lower 95% ! Upper 95% Intercept Test1 Test3 Seniority SUMMARY OUTPUT Regression Stotistics Multiple R R Square Adjusted R Square 0.561192897 Standard Error Observations 0.763813444 0.583410978 7.041676126 80 ANOVA df MS Significance F Regression Residual Total 4 75 79 5208.1098 1302.02745 26.25838718 1.25447E-13 3718.8902 49.58520267 8927 Intercept Seniority Test1 Test2 Test3 cients i standard Error \ t Stat : P-value Lower 95% \ Upper 95% 6.556648312 6.187208791.0597102080.292677367-5.768903646 18.88220027 0.1548926 5.1714114671.86978E-06 0.492451485 1.109575248 0.300456252 0.111578322.6927834230.008736095 0.078180839 0.522731664 0.0861836760.134673553 0.639945066 0.5241584650.182099799 0.354467151 0.4070680560.154289756 2.638334952 0.010126064 0.099707101 0.714429011 0.801013366